
Dashboard
app.MapSurefireDashboard(); // at /surefireapp.MapSurefireDashboard("/admin"); // custom prefixThe dashboard is embedded in the Surefire.Dashboard package — no extra files or build steps.
Authorization
Section titled “Authorization”The dashboard endpoints have no authorization by default. In production, you should restrict access:
app.MapSurefireDashboard() .RequireAuthorization("AdminPolicy");MapSurefireDashboard returns an IEndpointConventionBuilder, so you can chain any ASP.NET Core endpoint convention including RequireAuthorization, RequireCors, or custom metadata.
Without authorization, anyone who can reach the dashboard can view job arguments, trigger jobs, cancel runs, and manage queues.
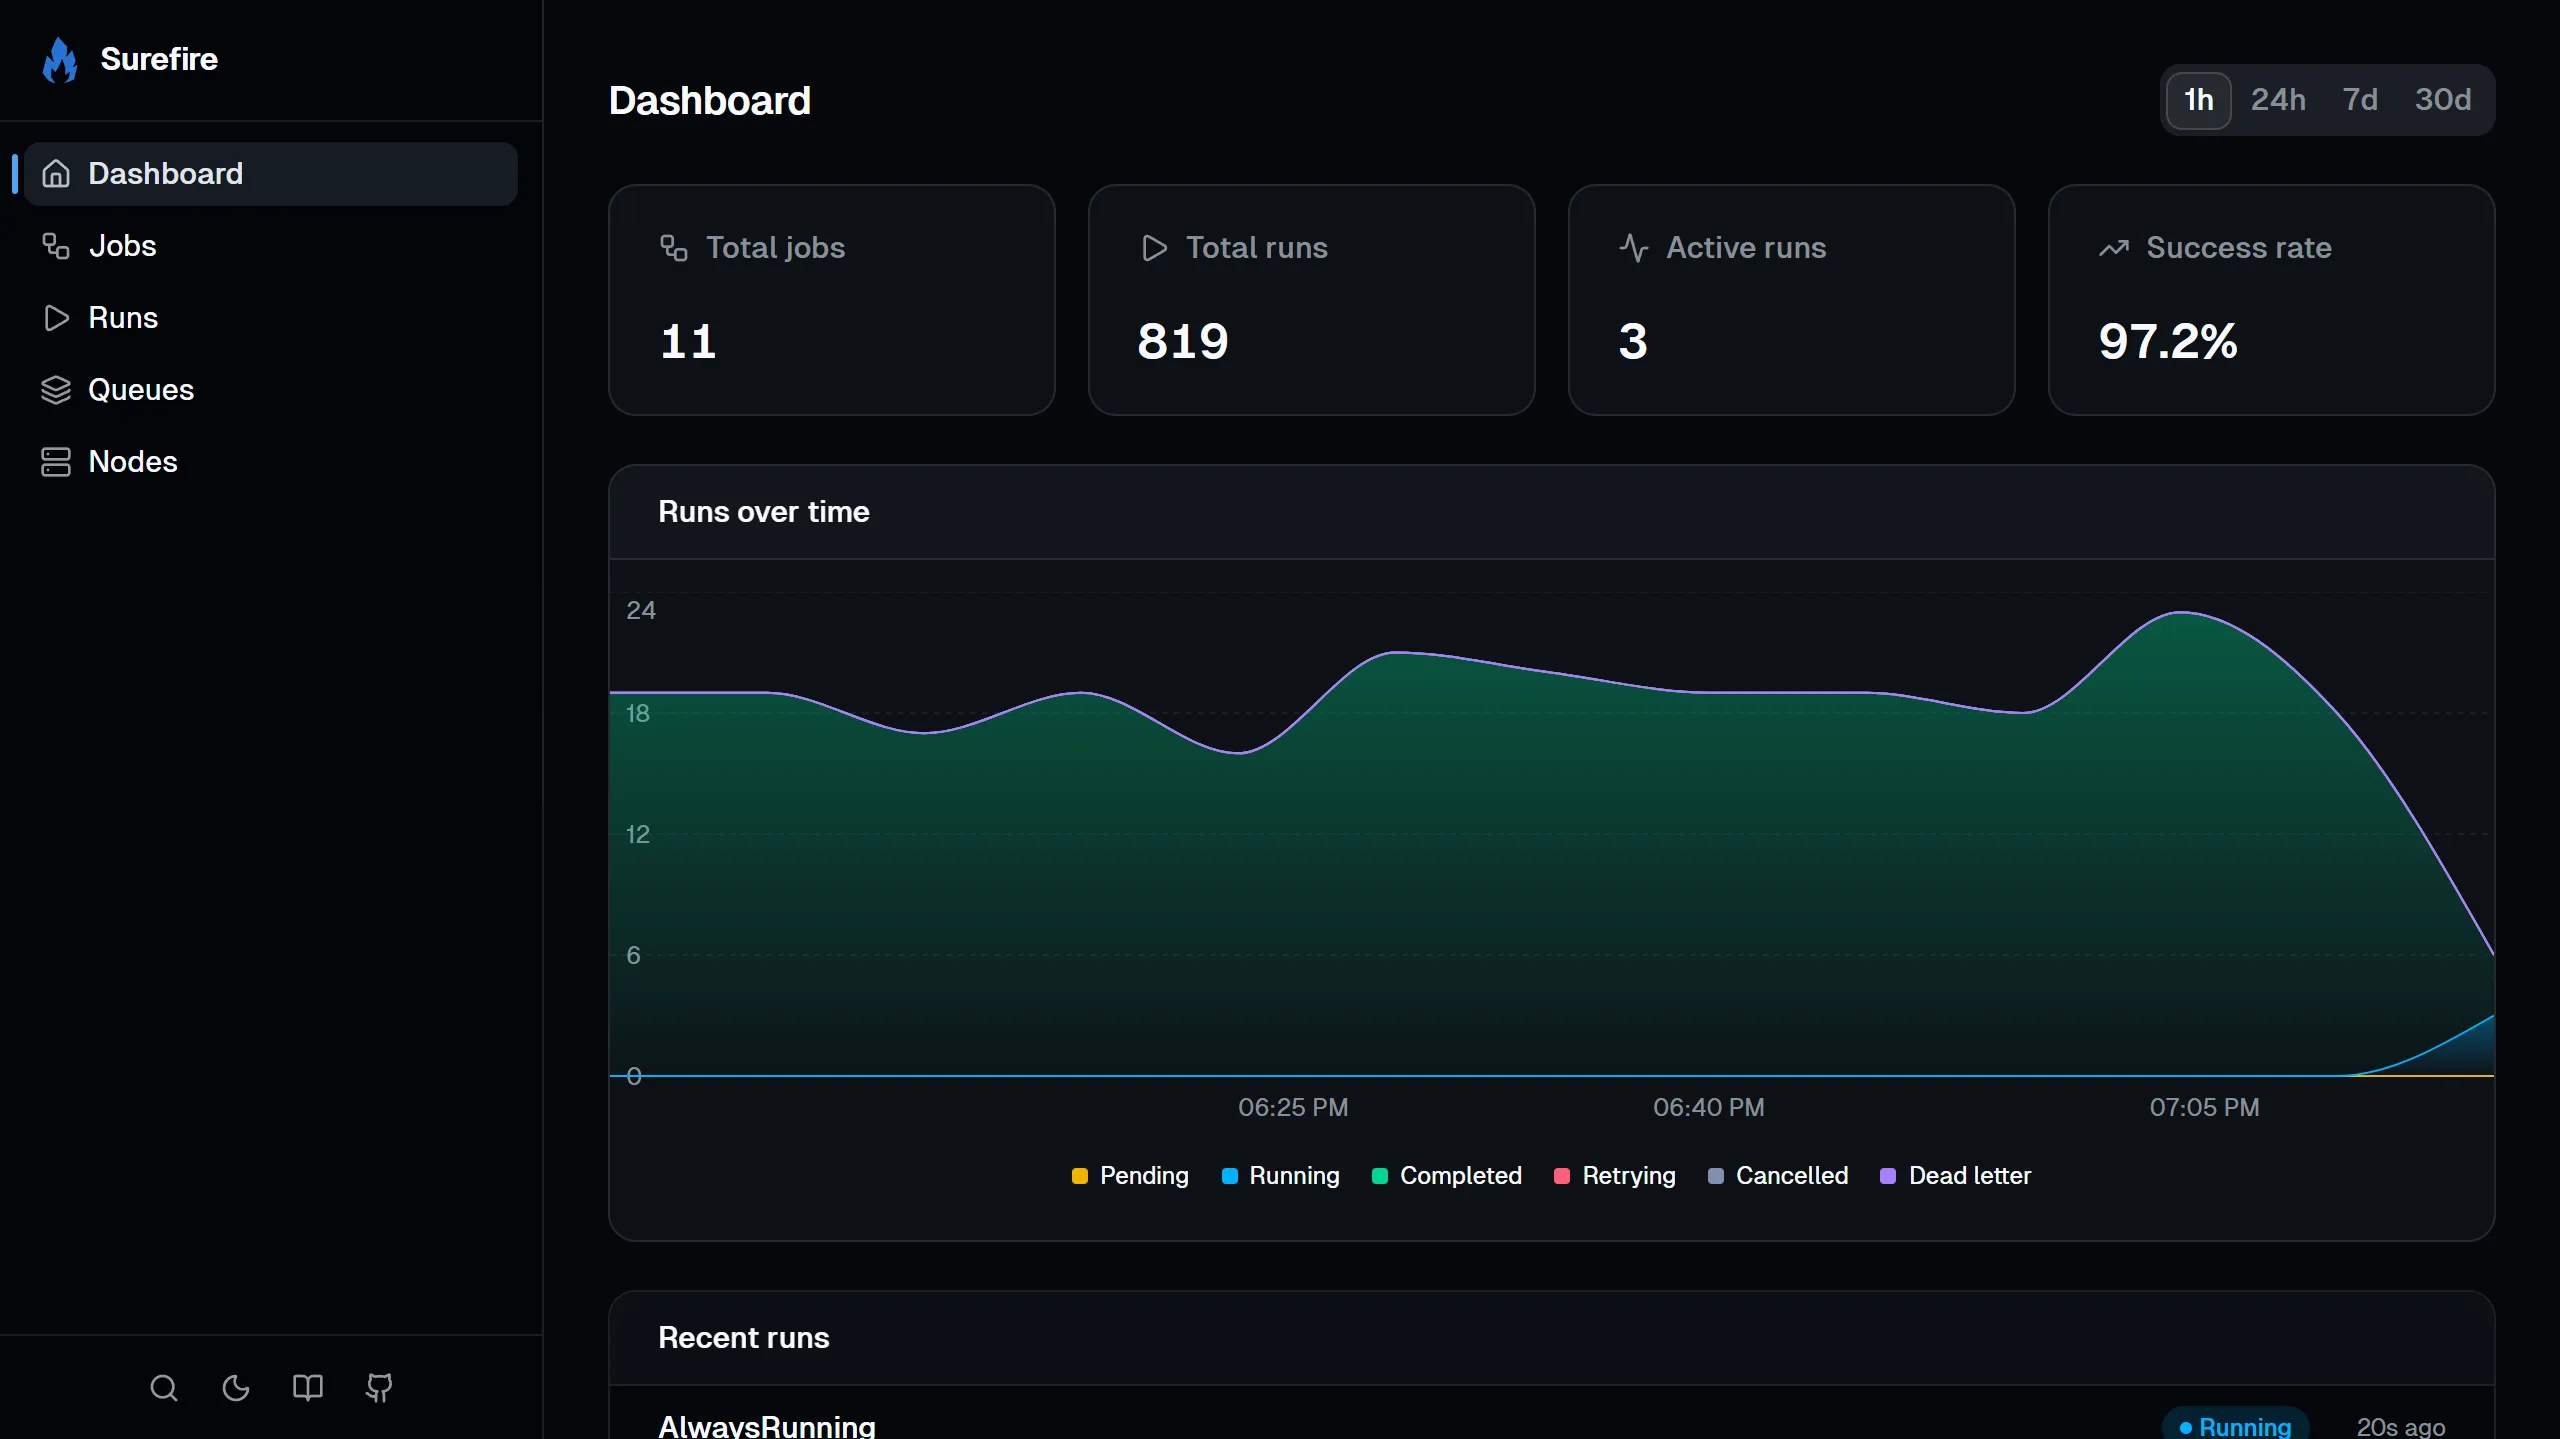
The home page gives you a quick overview:
- Stat cards — total jobs, total runs, active runs, and success rate.
- Runs over time — a stacked area chart showing runs by status. Toggle between 1h, 24h, 7d, and 30d.
- Recent runs — the latest runs with status badges.
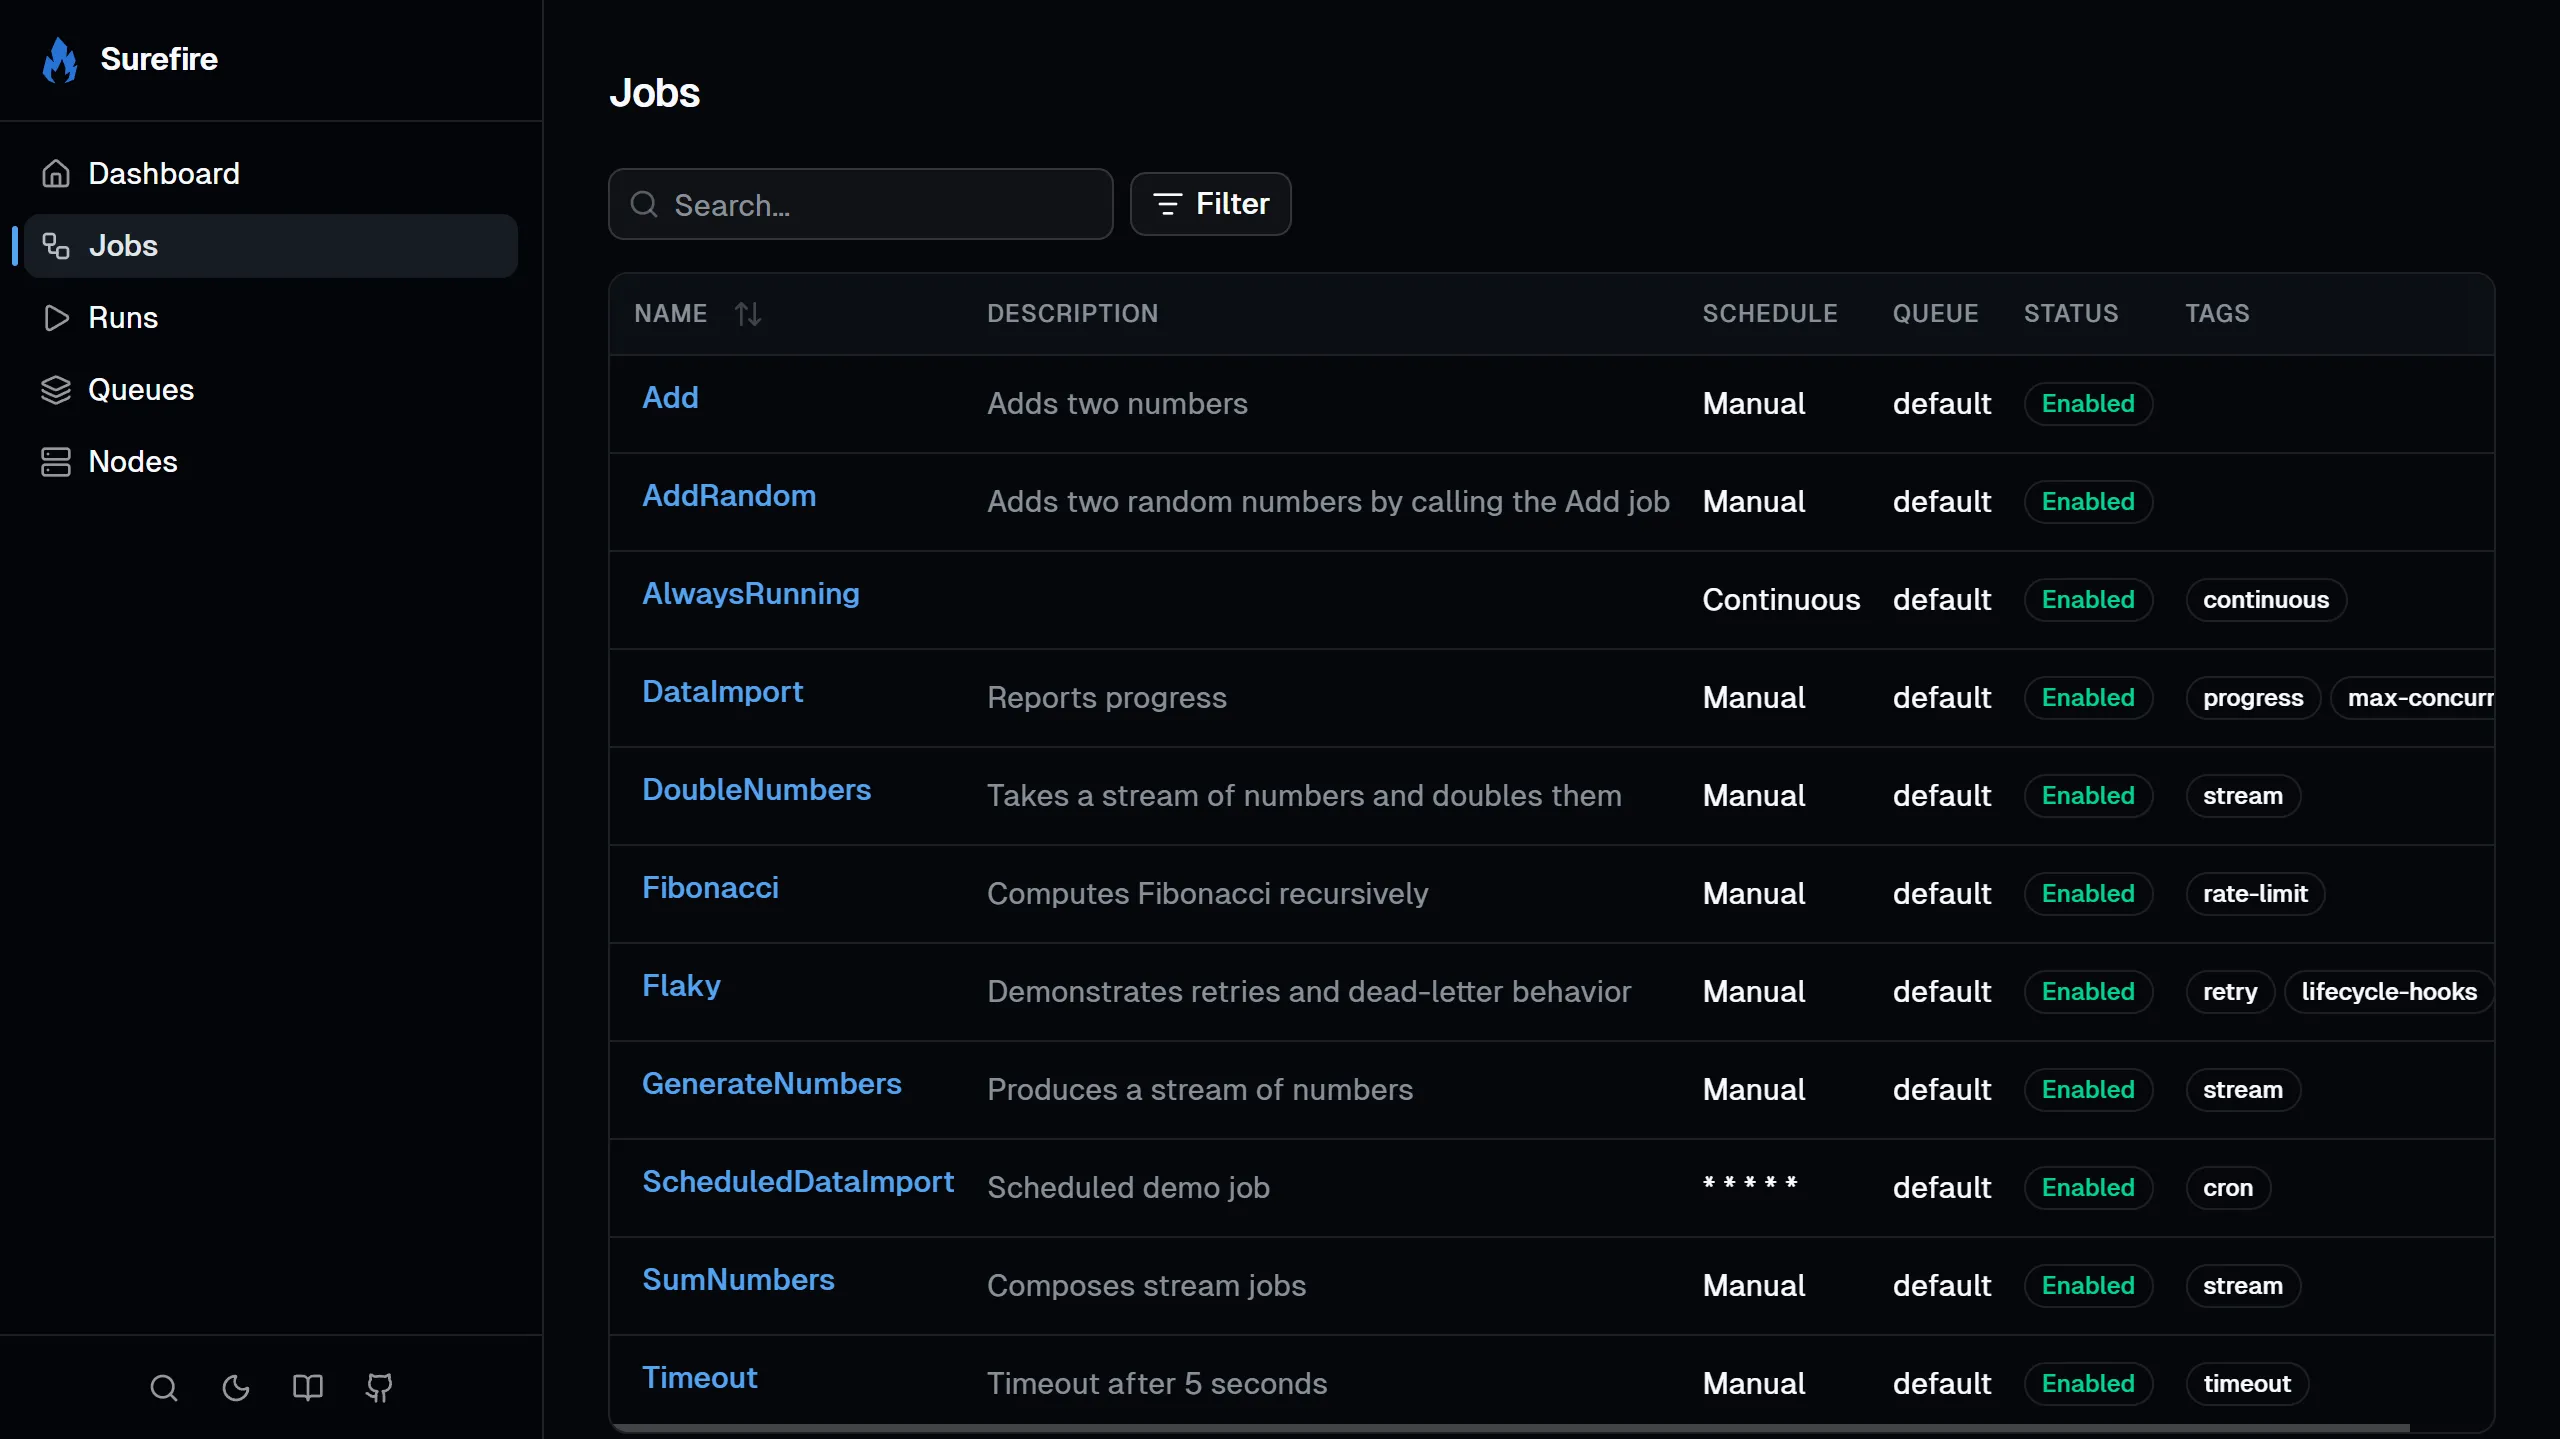
Lists all registered jobs with their name, description, cron schedule, enabled/disabled status, and tags.
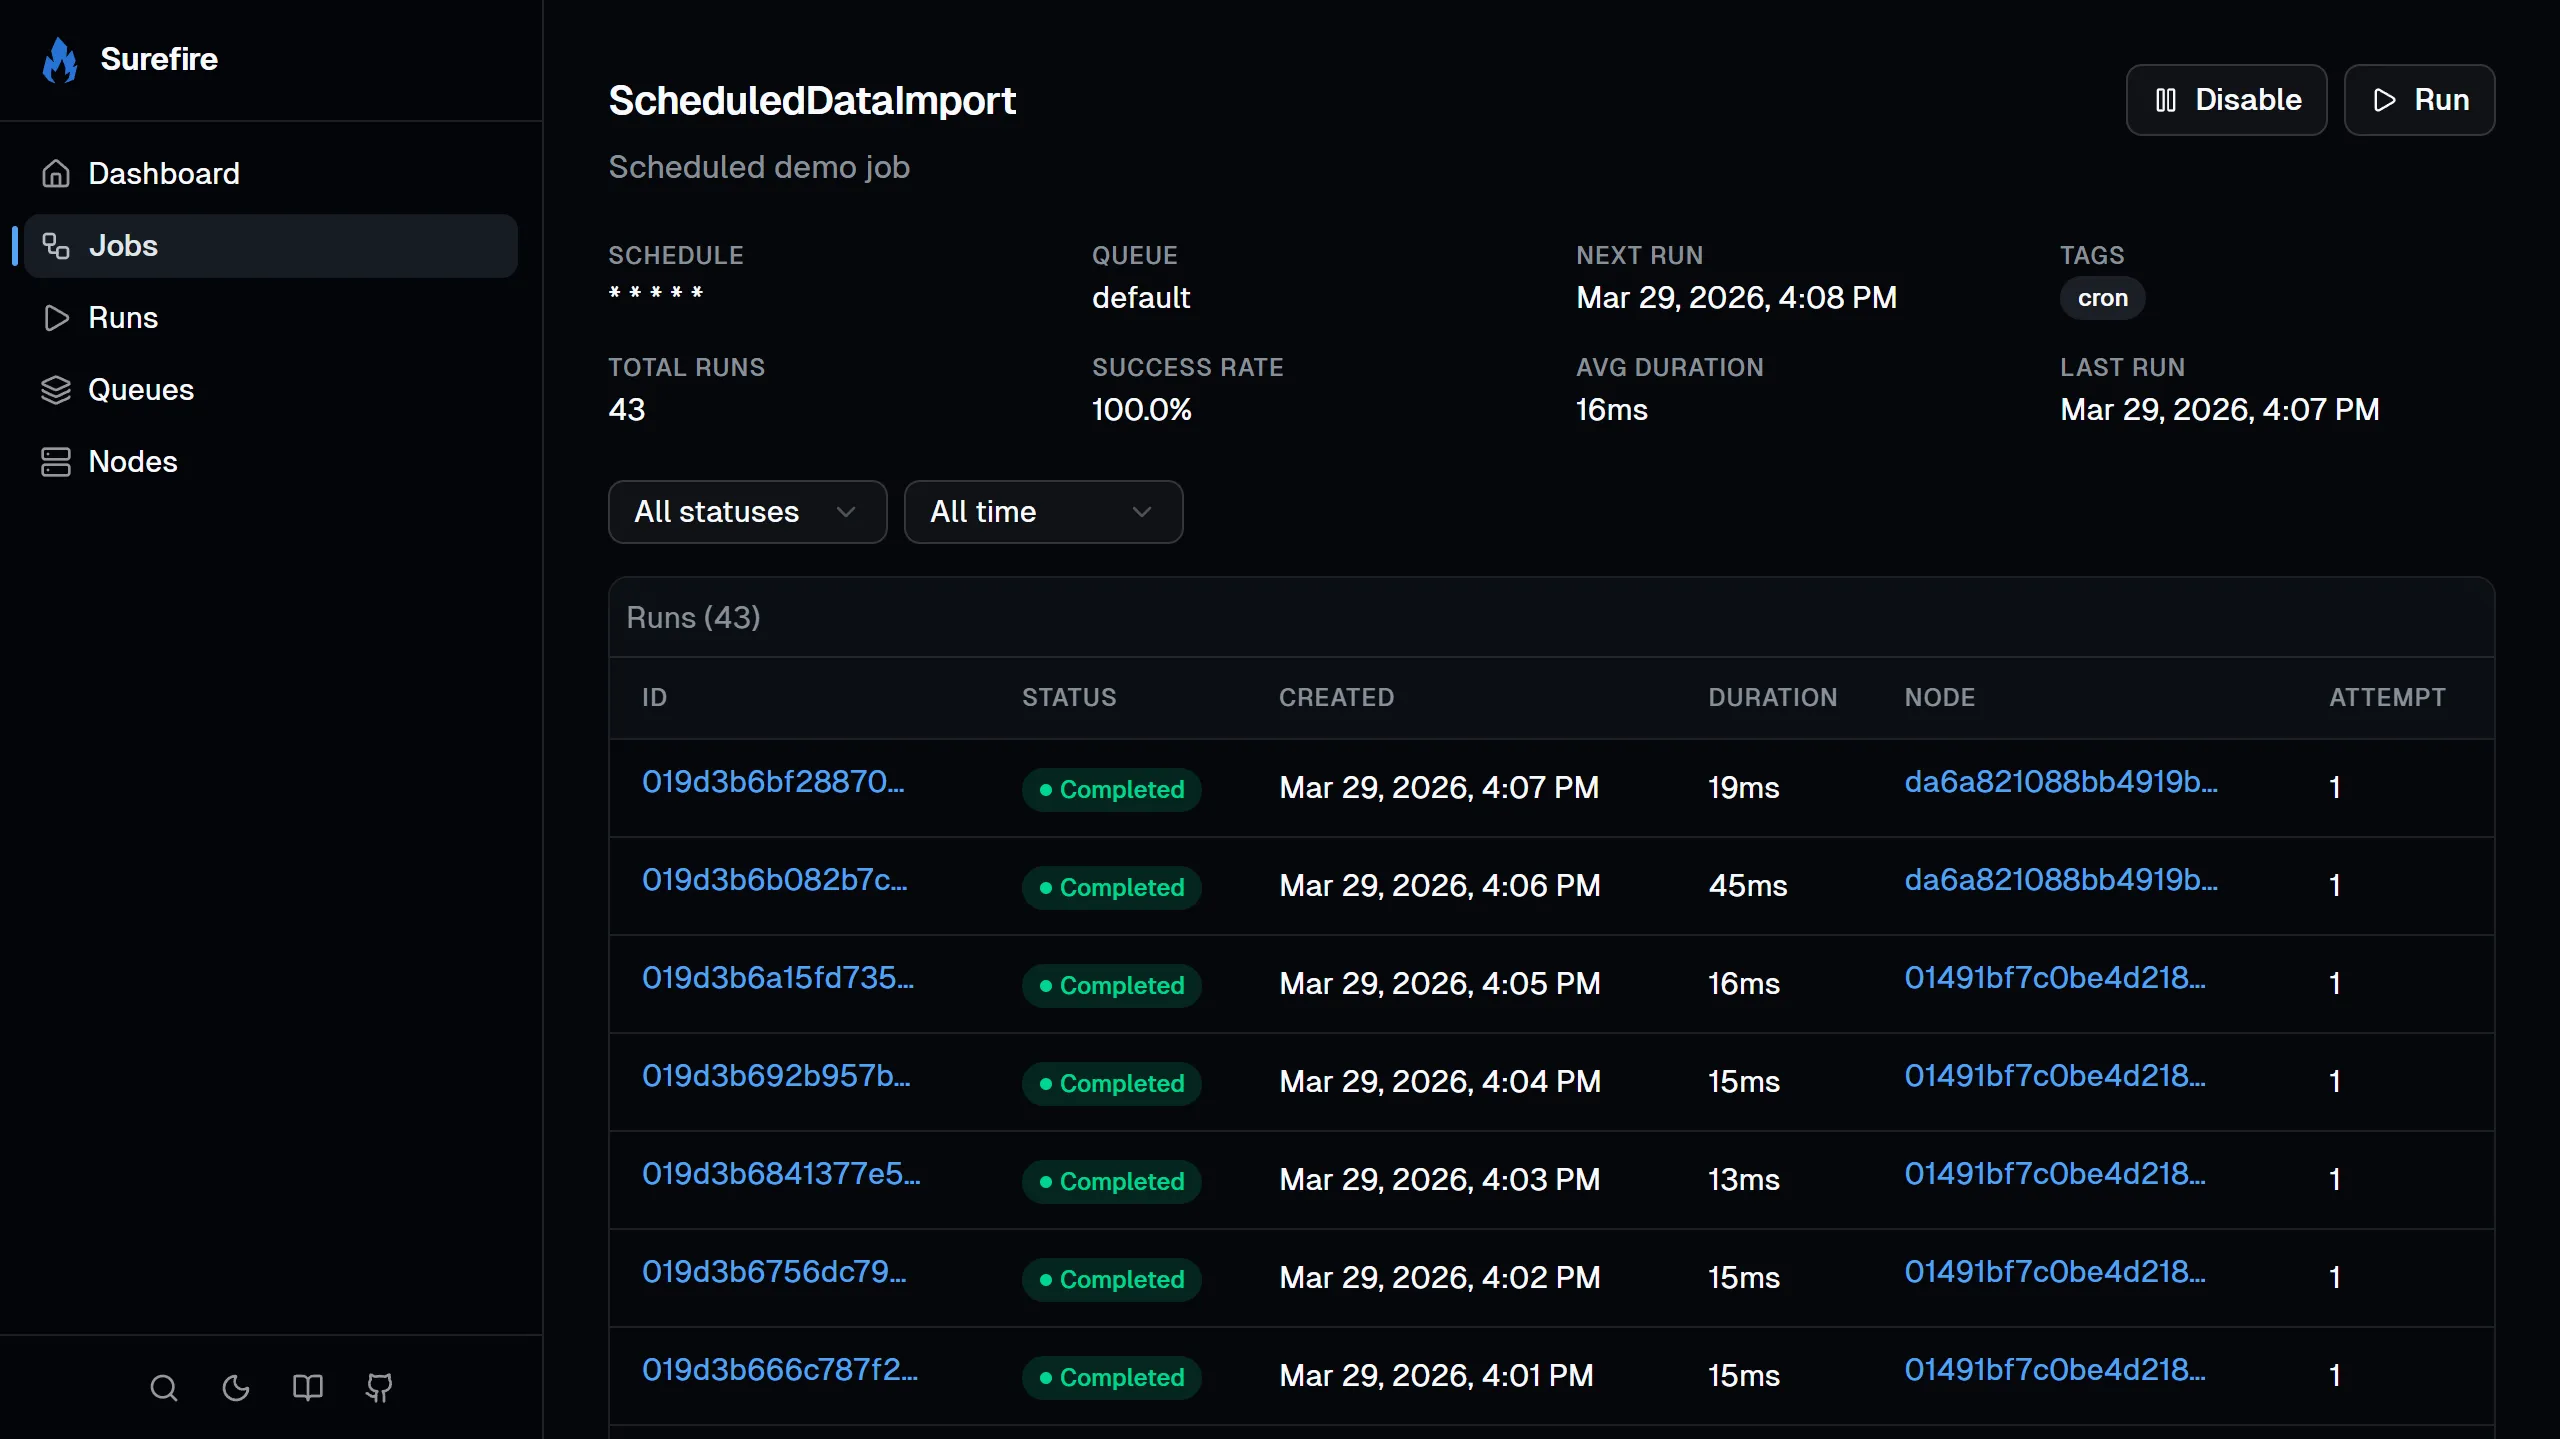
Click into a job to:
- Enable or disable it (disabling stops cron scheduling).
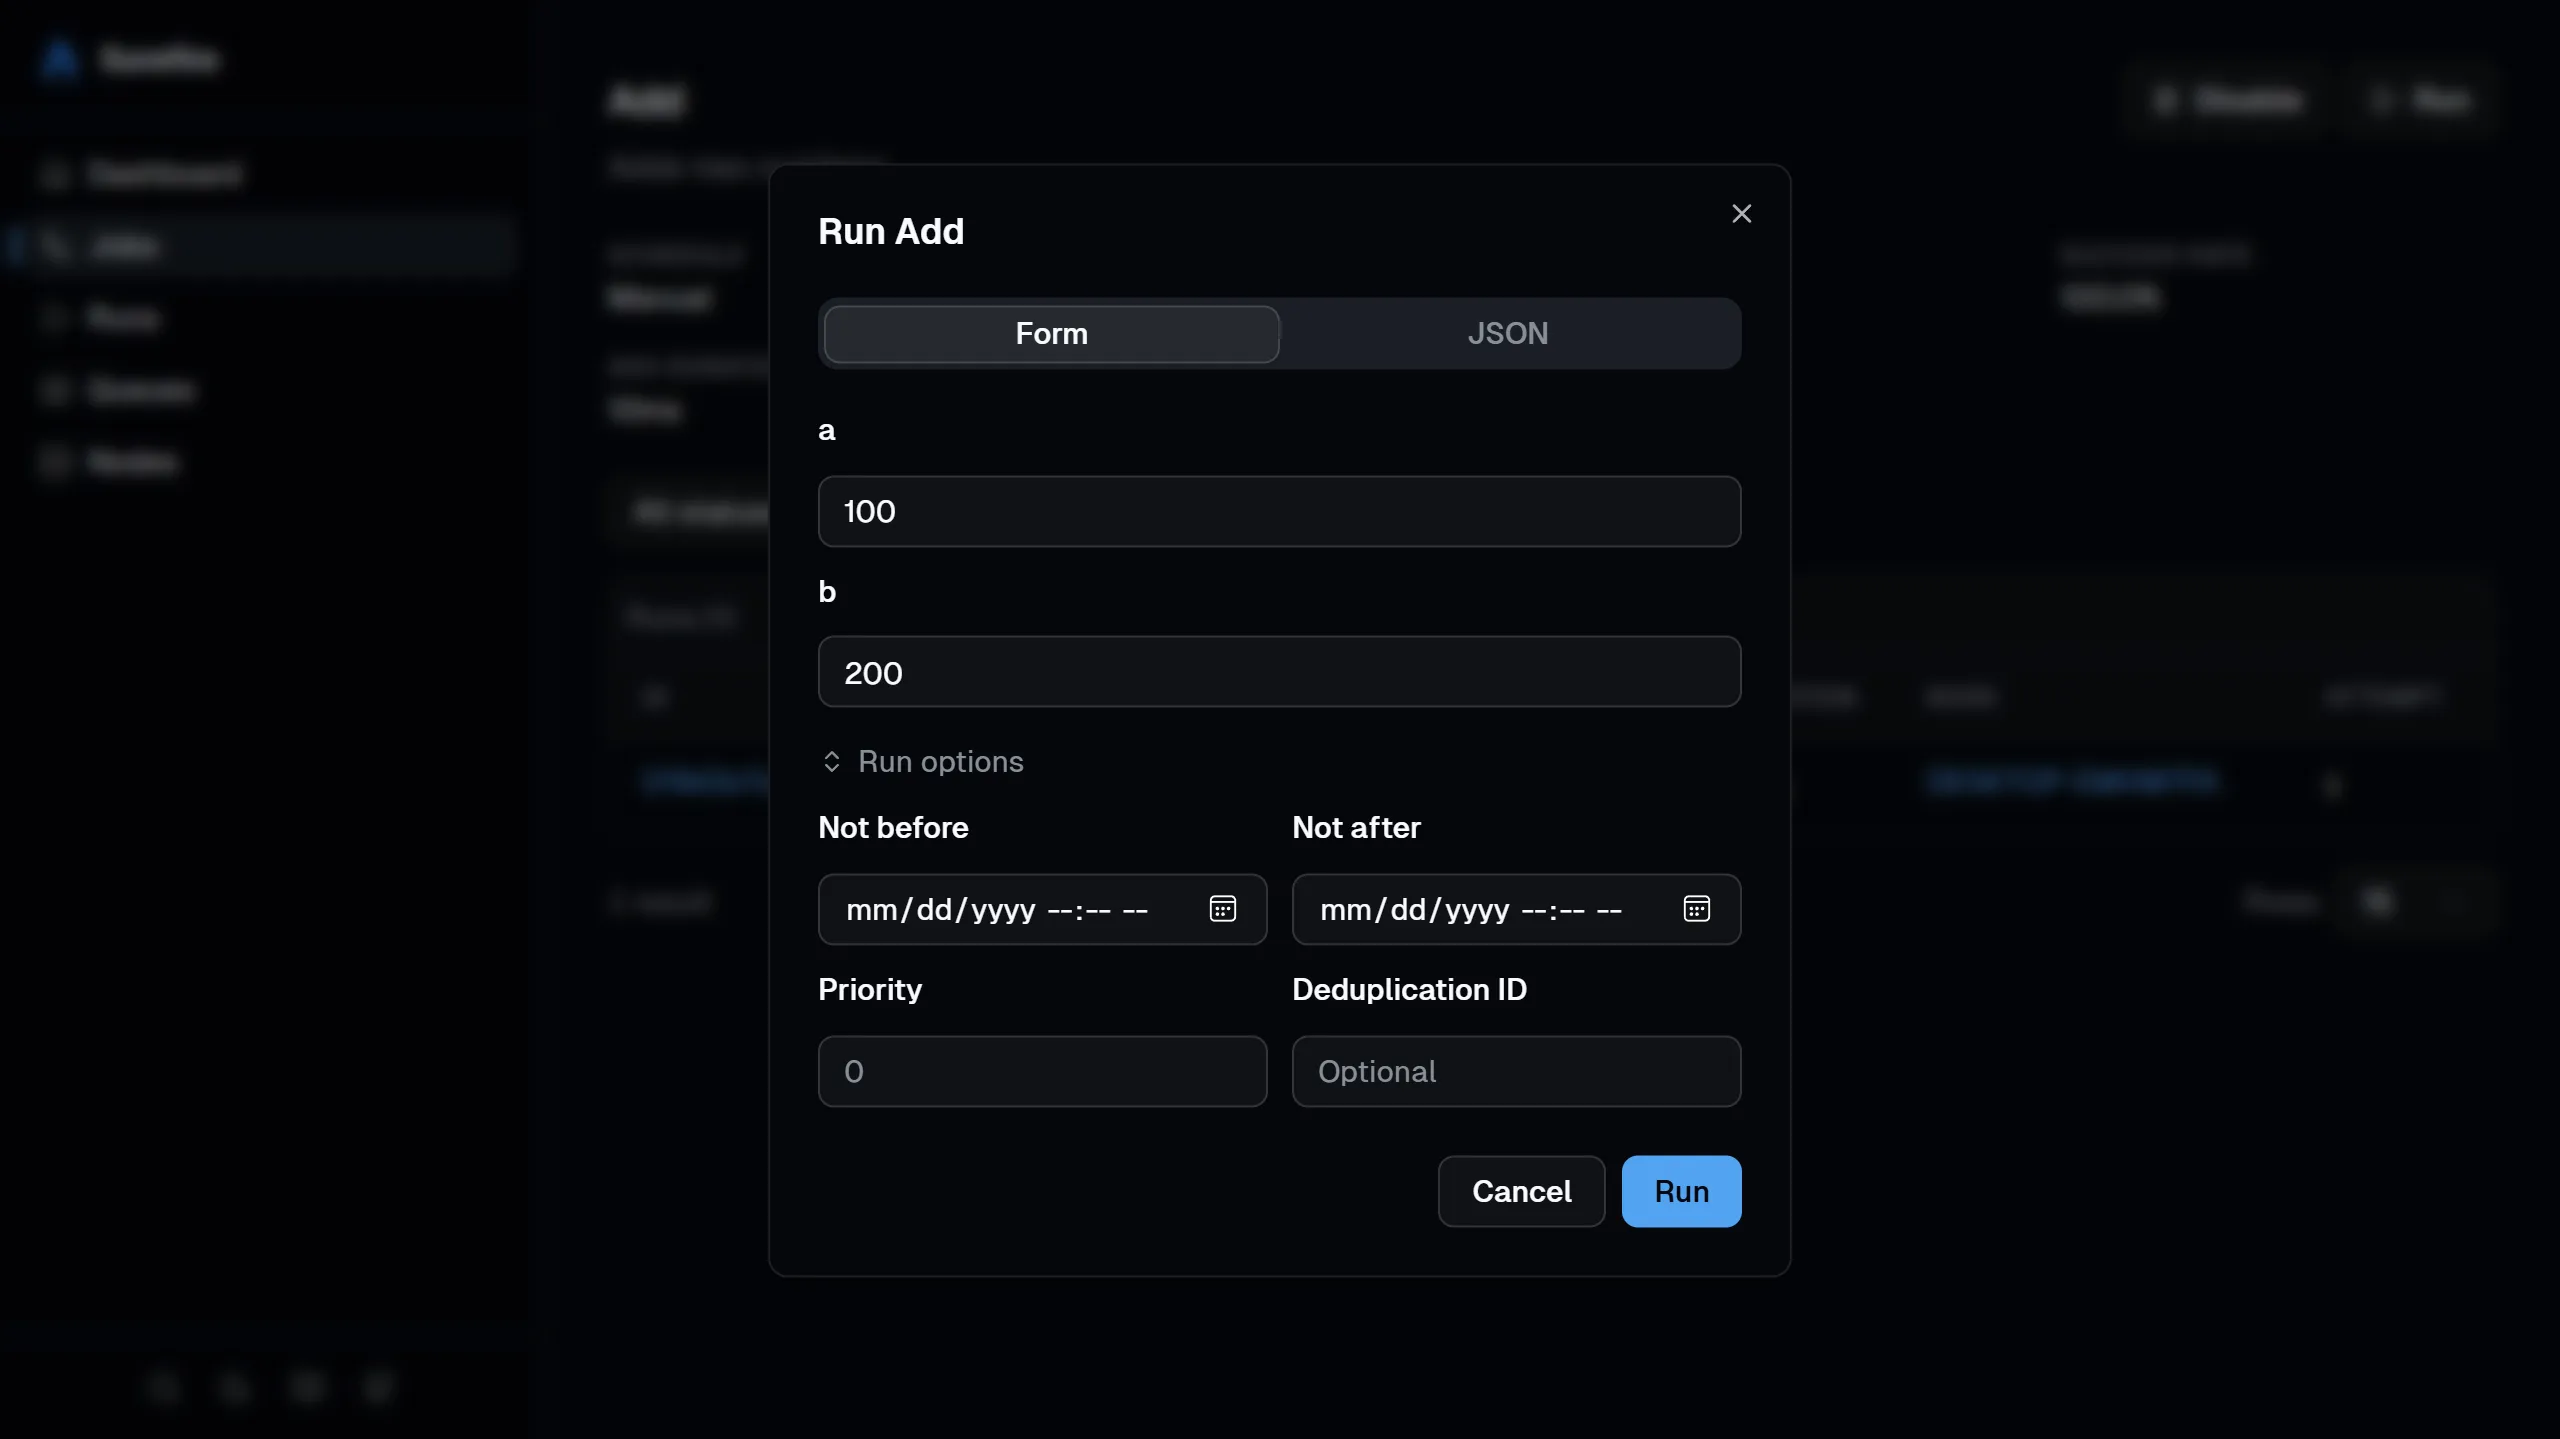
- Trigger a run with optional JSON arguments, a scheduled start time, and priority.
- See the job’s run history with pagination.
Lists all runs with filters for job name, status, and date range.
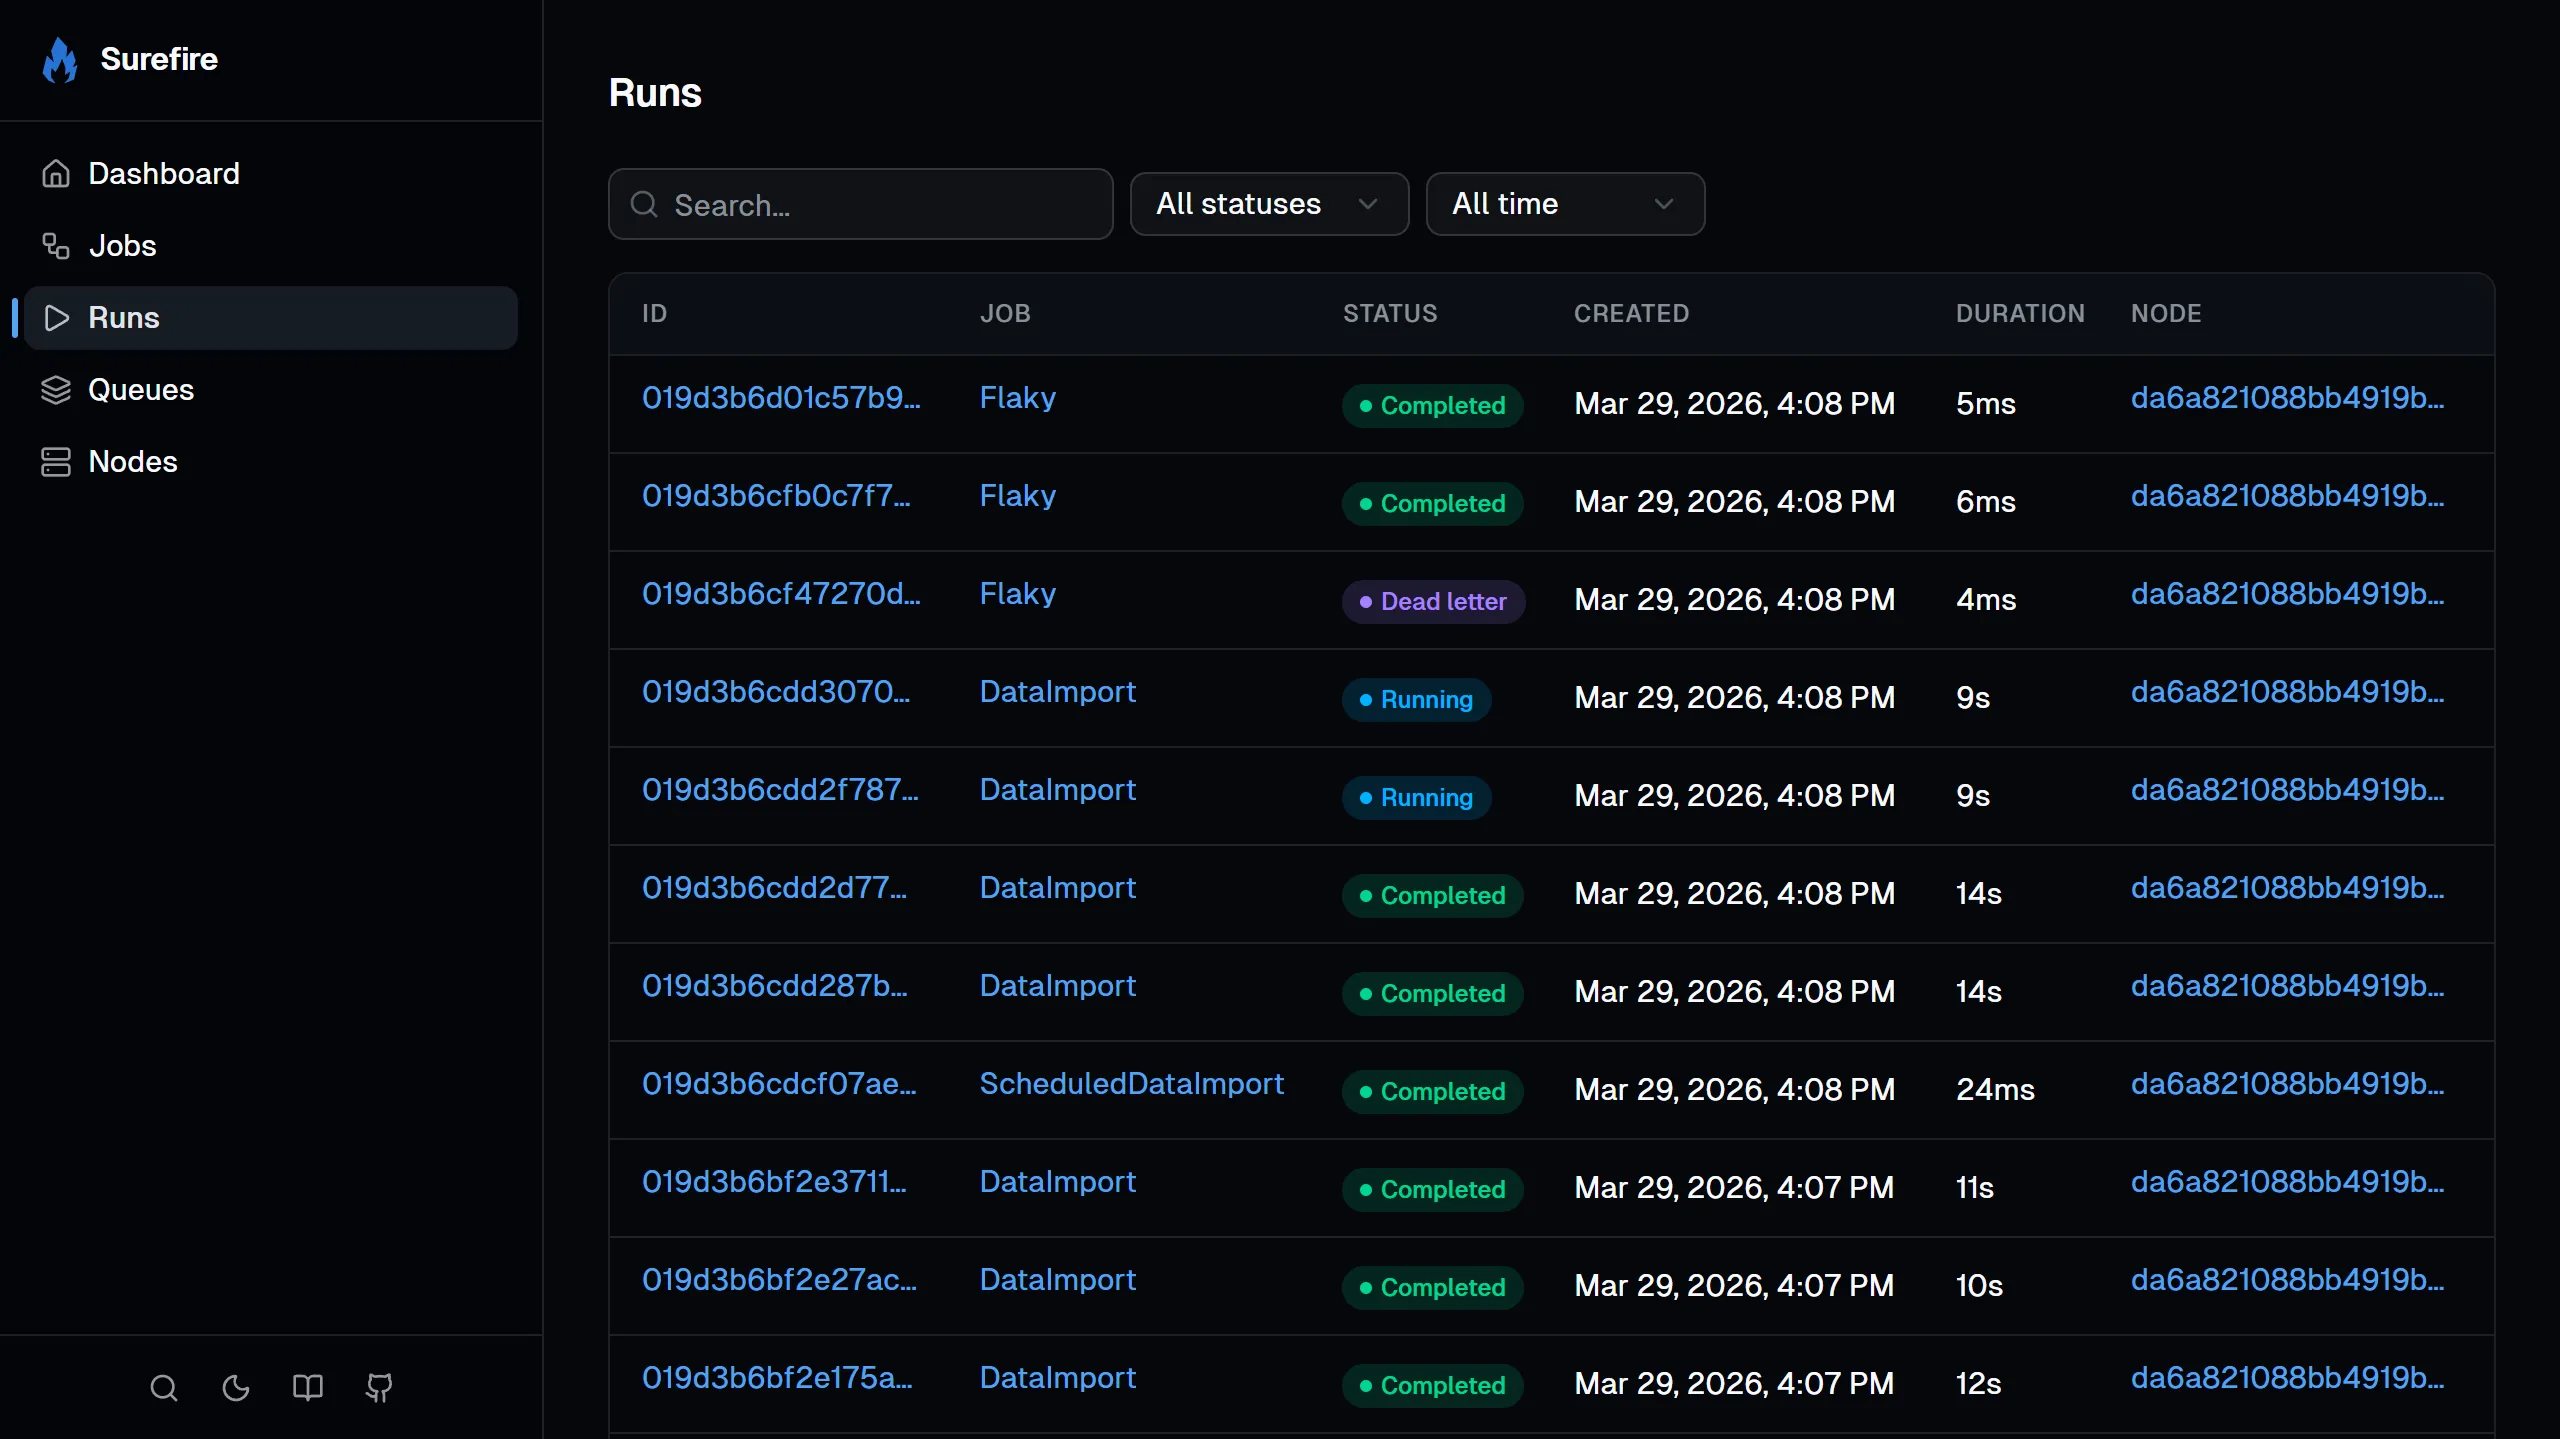
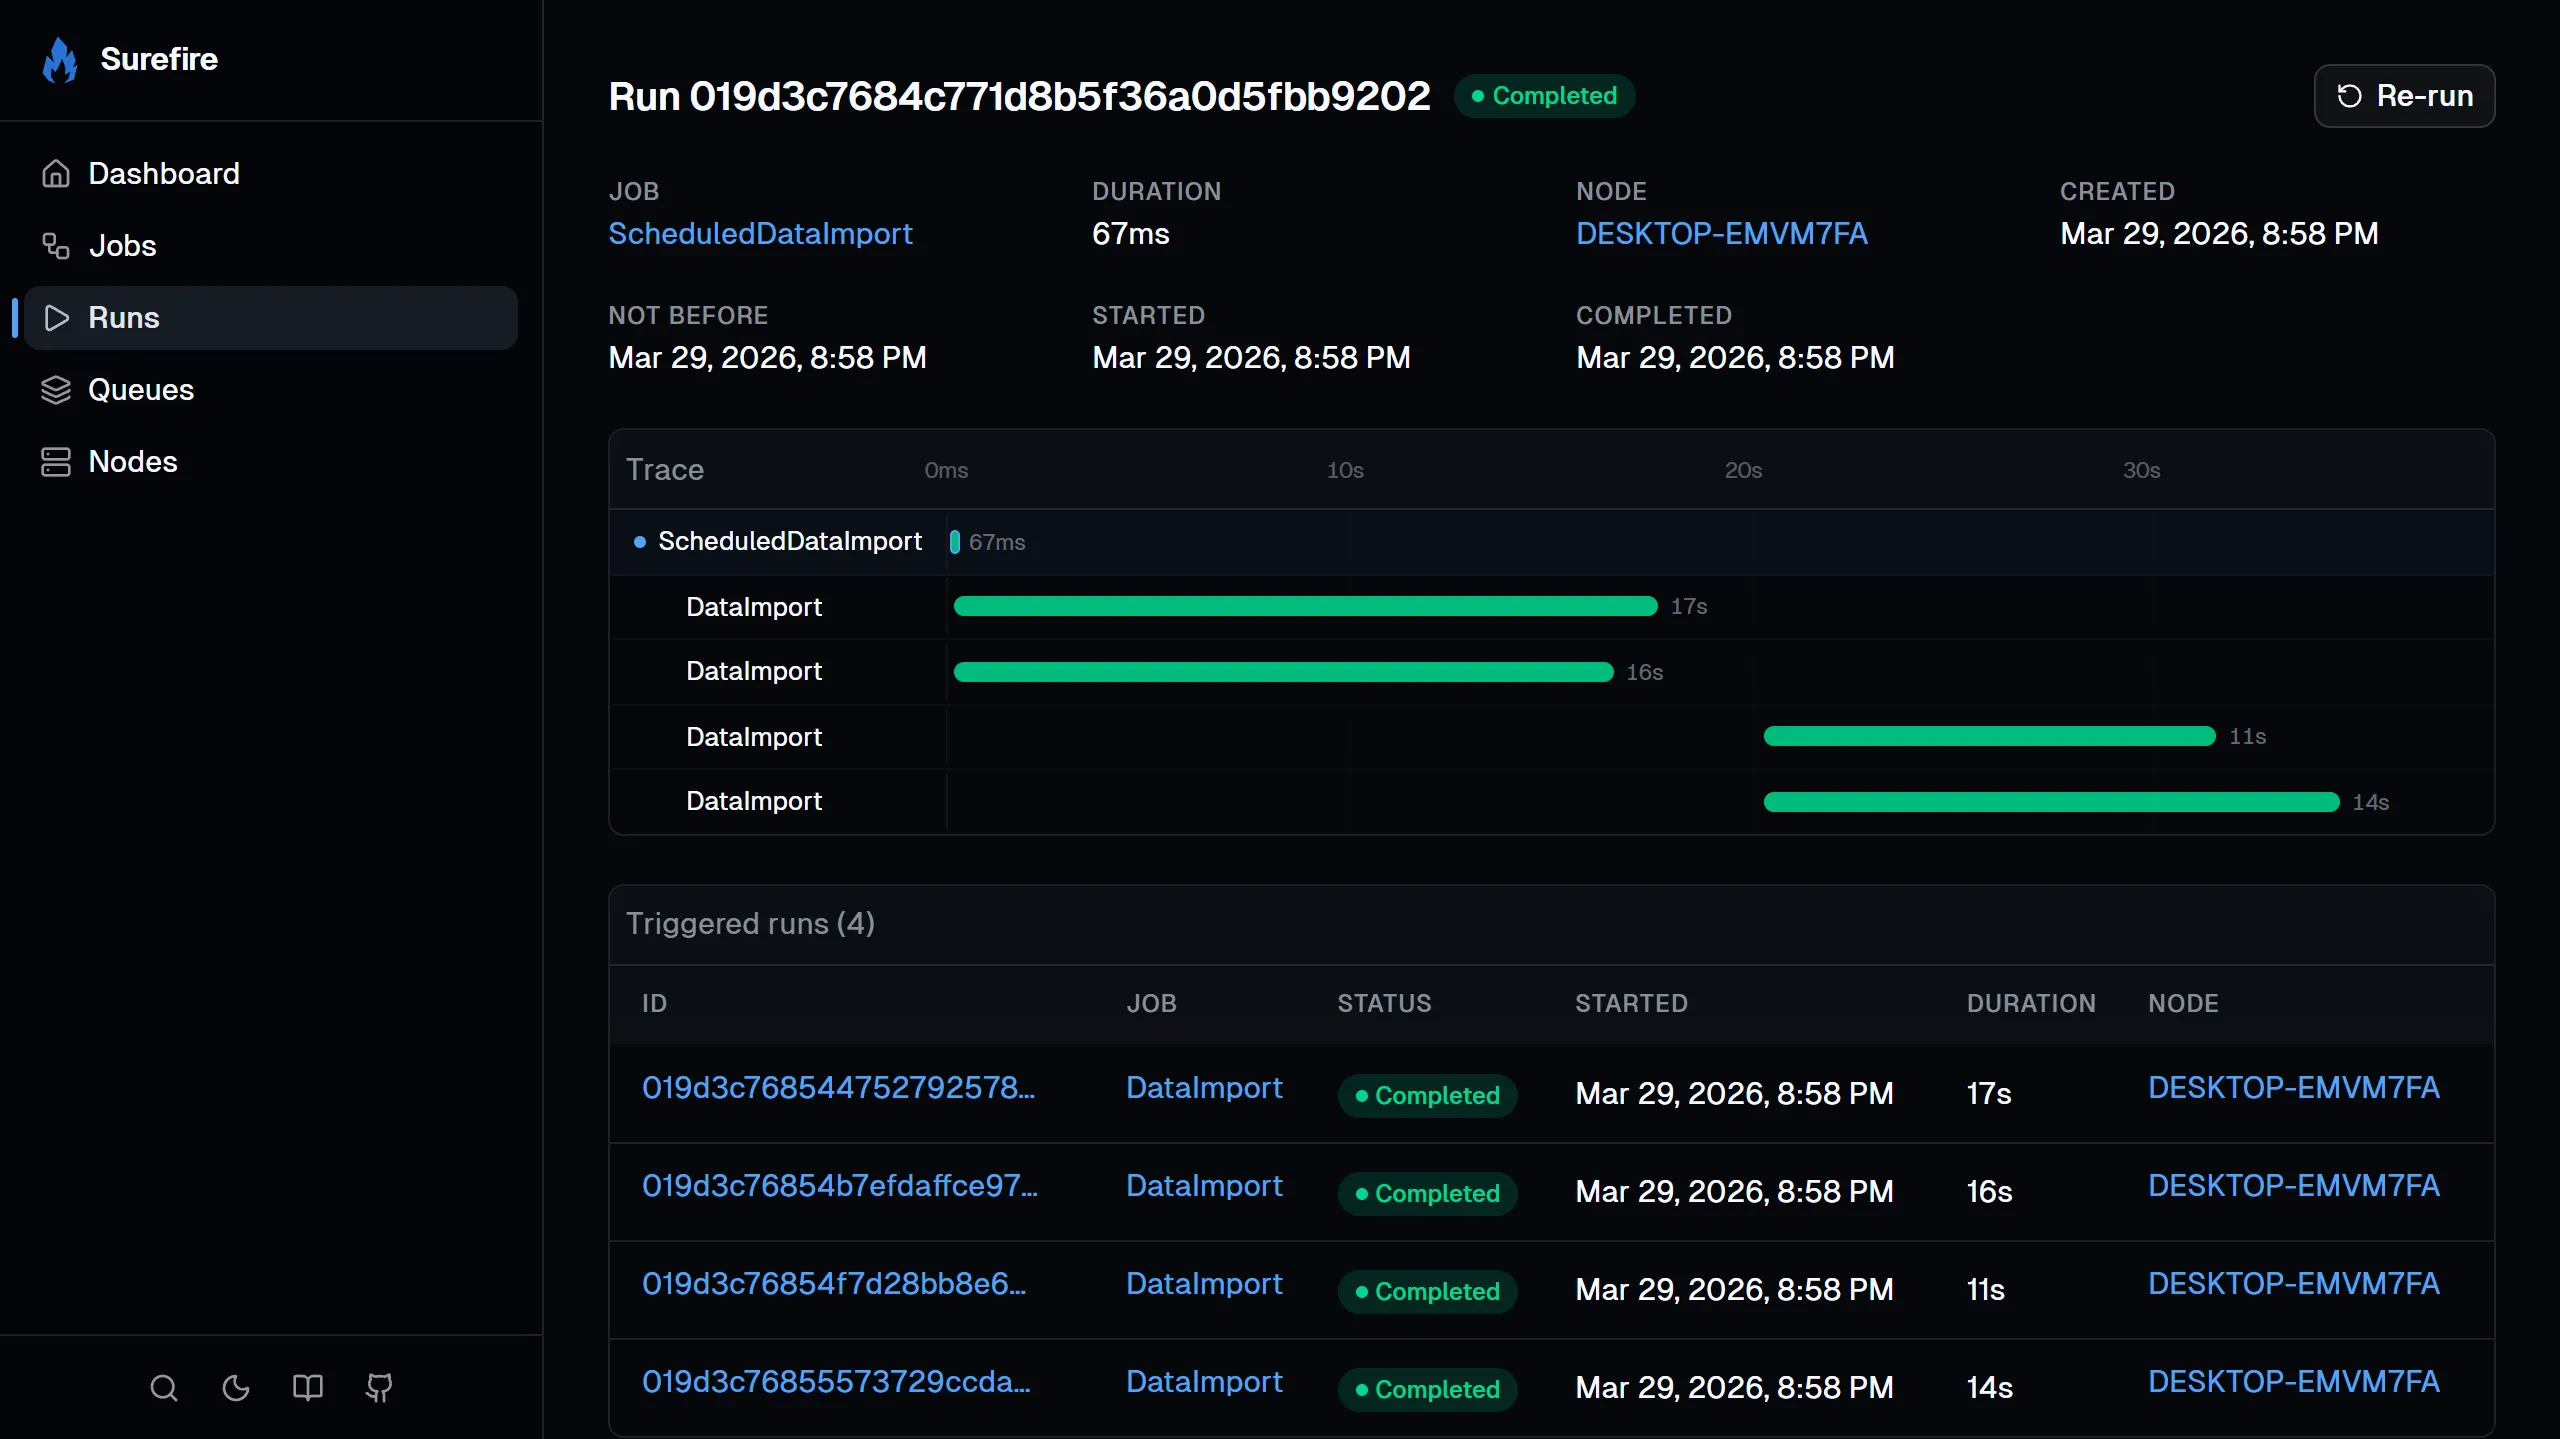
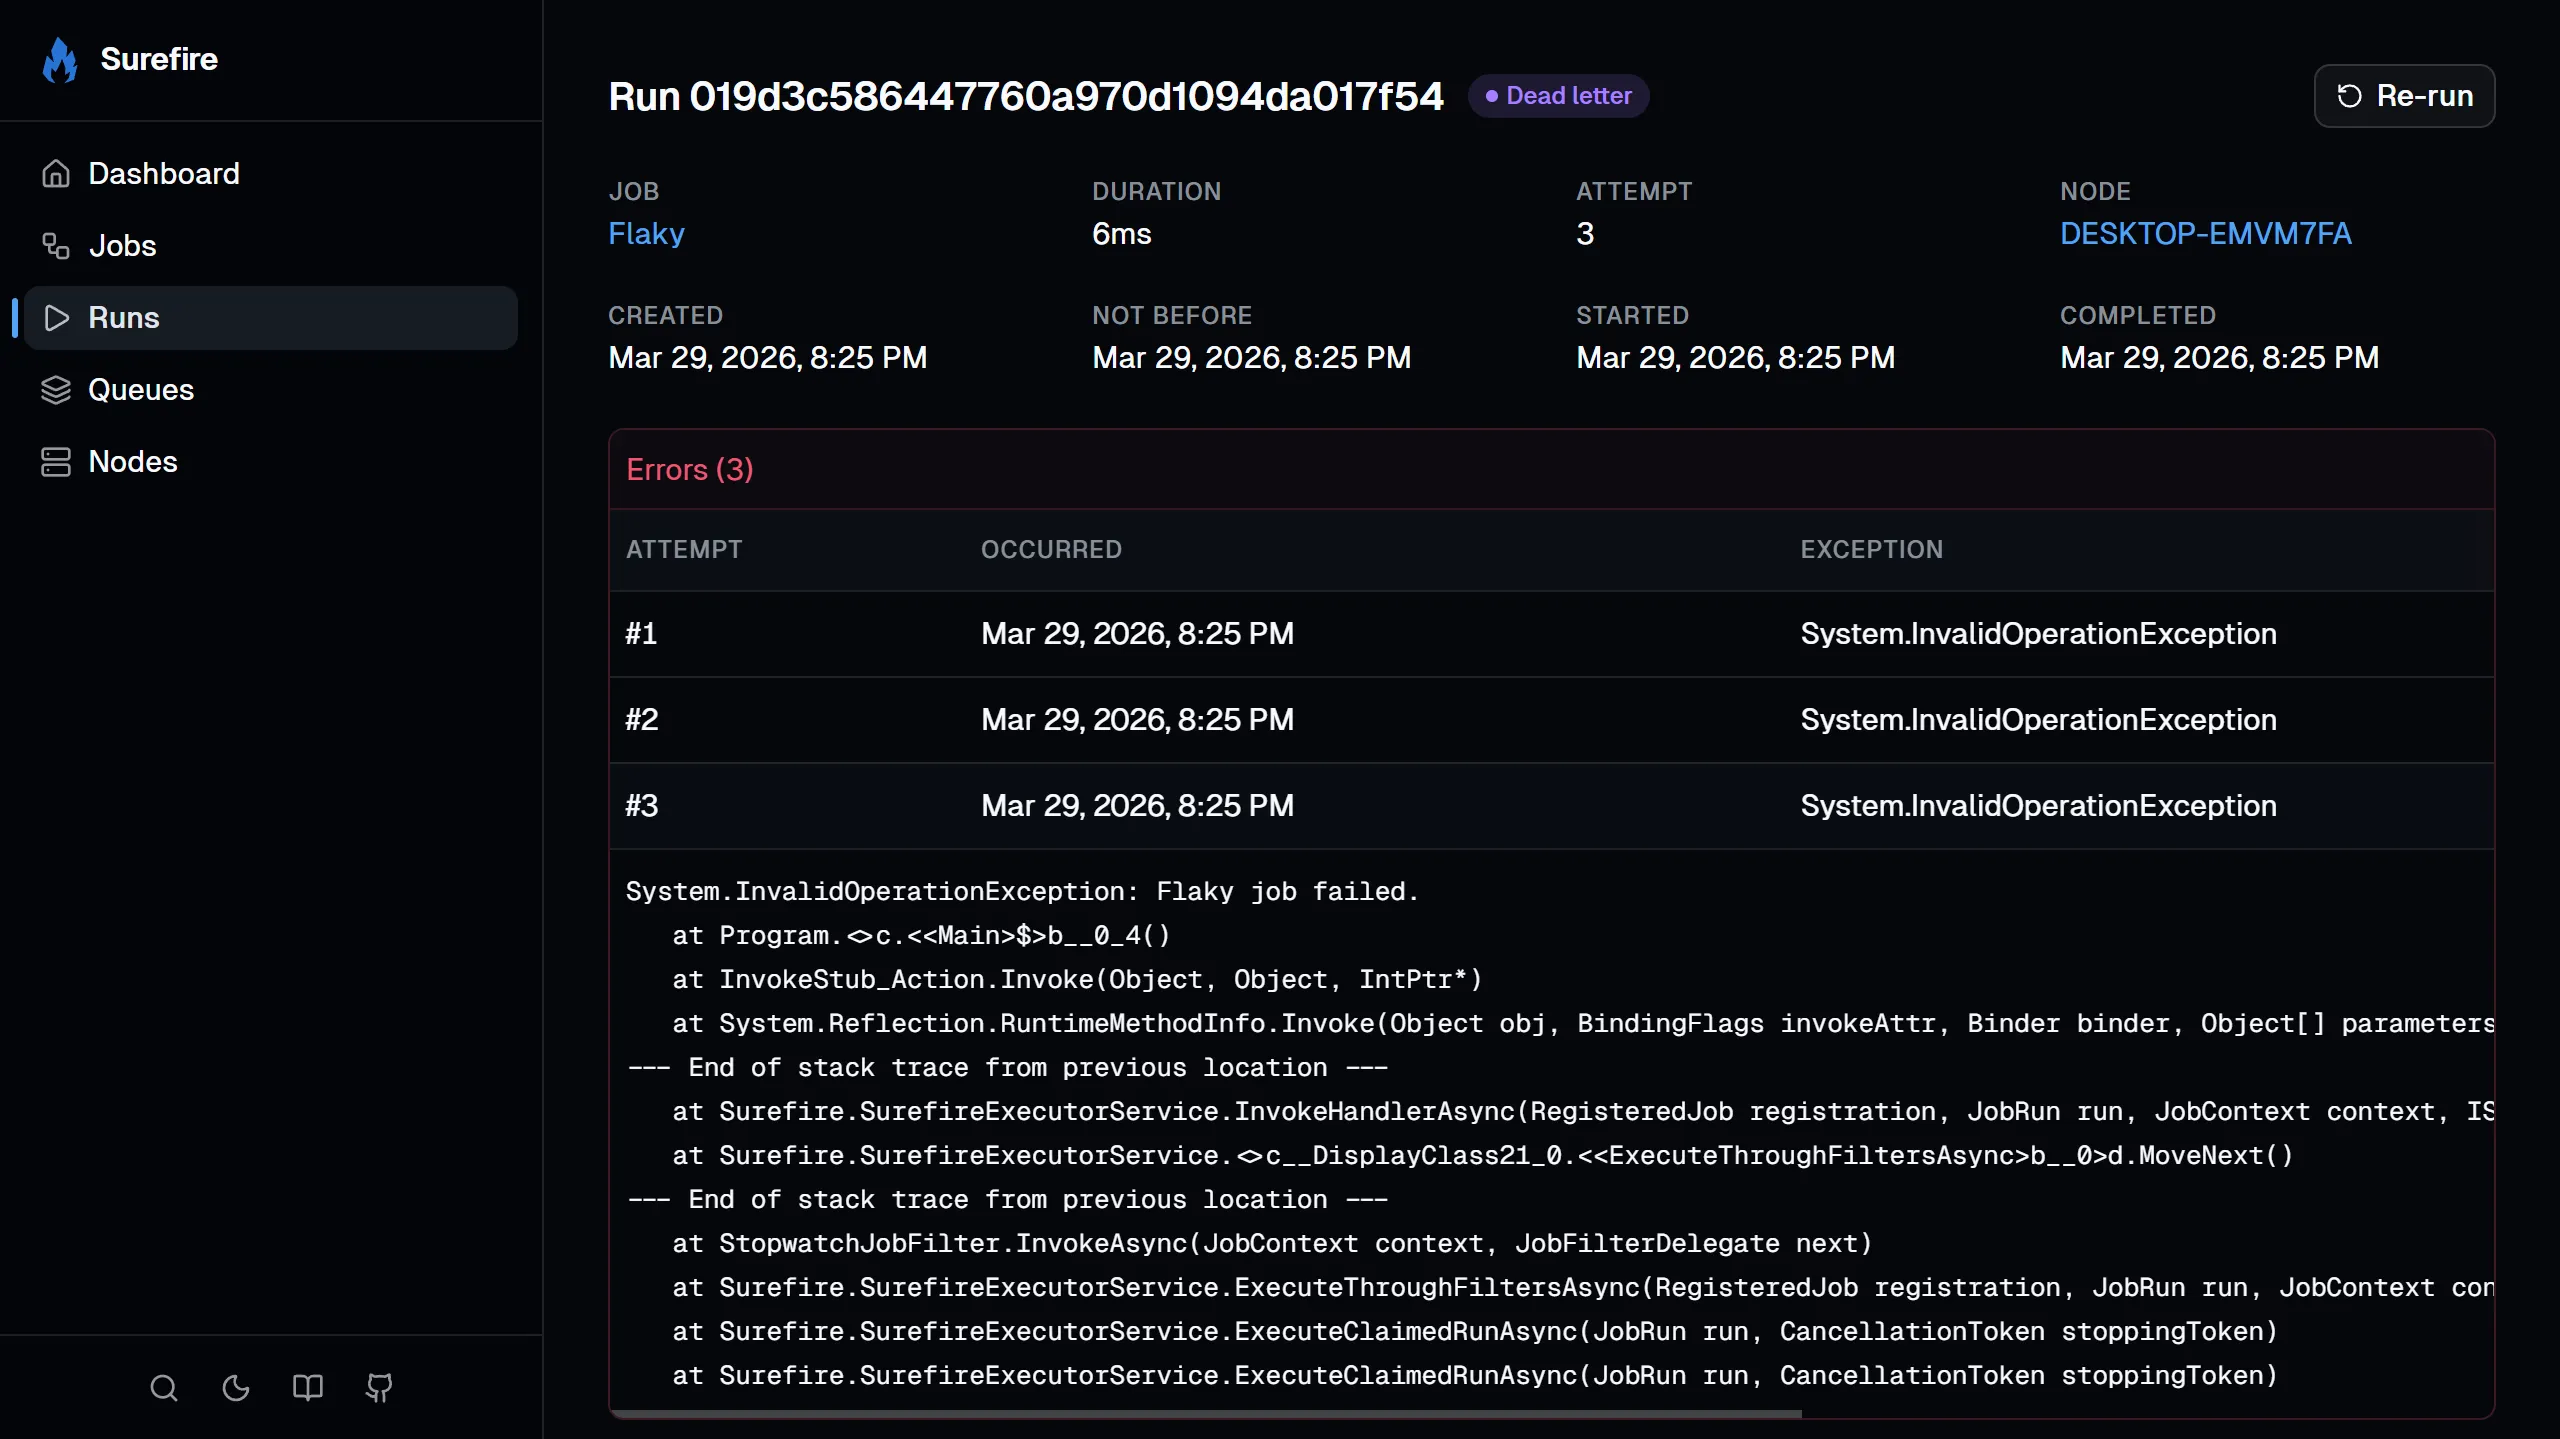
Click into a run to see:
- Live progress bar for running jobs.
- Streaming logs that update in real-time as the job runs.
- Arguments and result as formatted JSON.
- Error details for failed runs.
- Trace view — a timeline showing parent/child run relationships.
- Rerun chain — links between manually rerun attempts.
- Triggered runs — any child runs this job created.
- Cancel a running job or re-run a completed one.
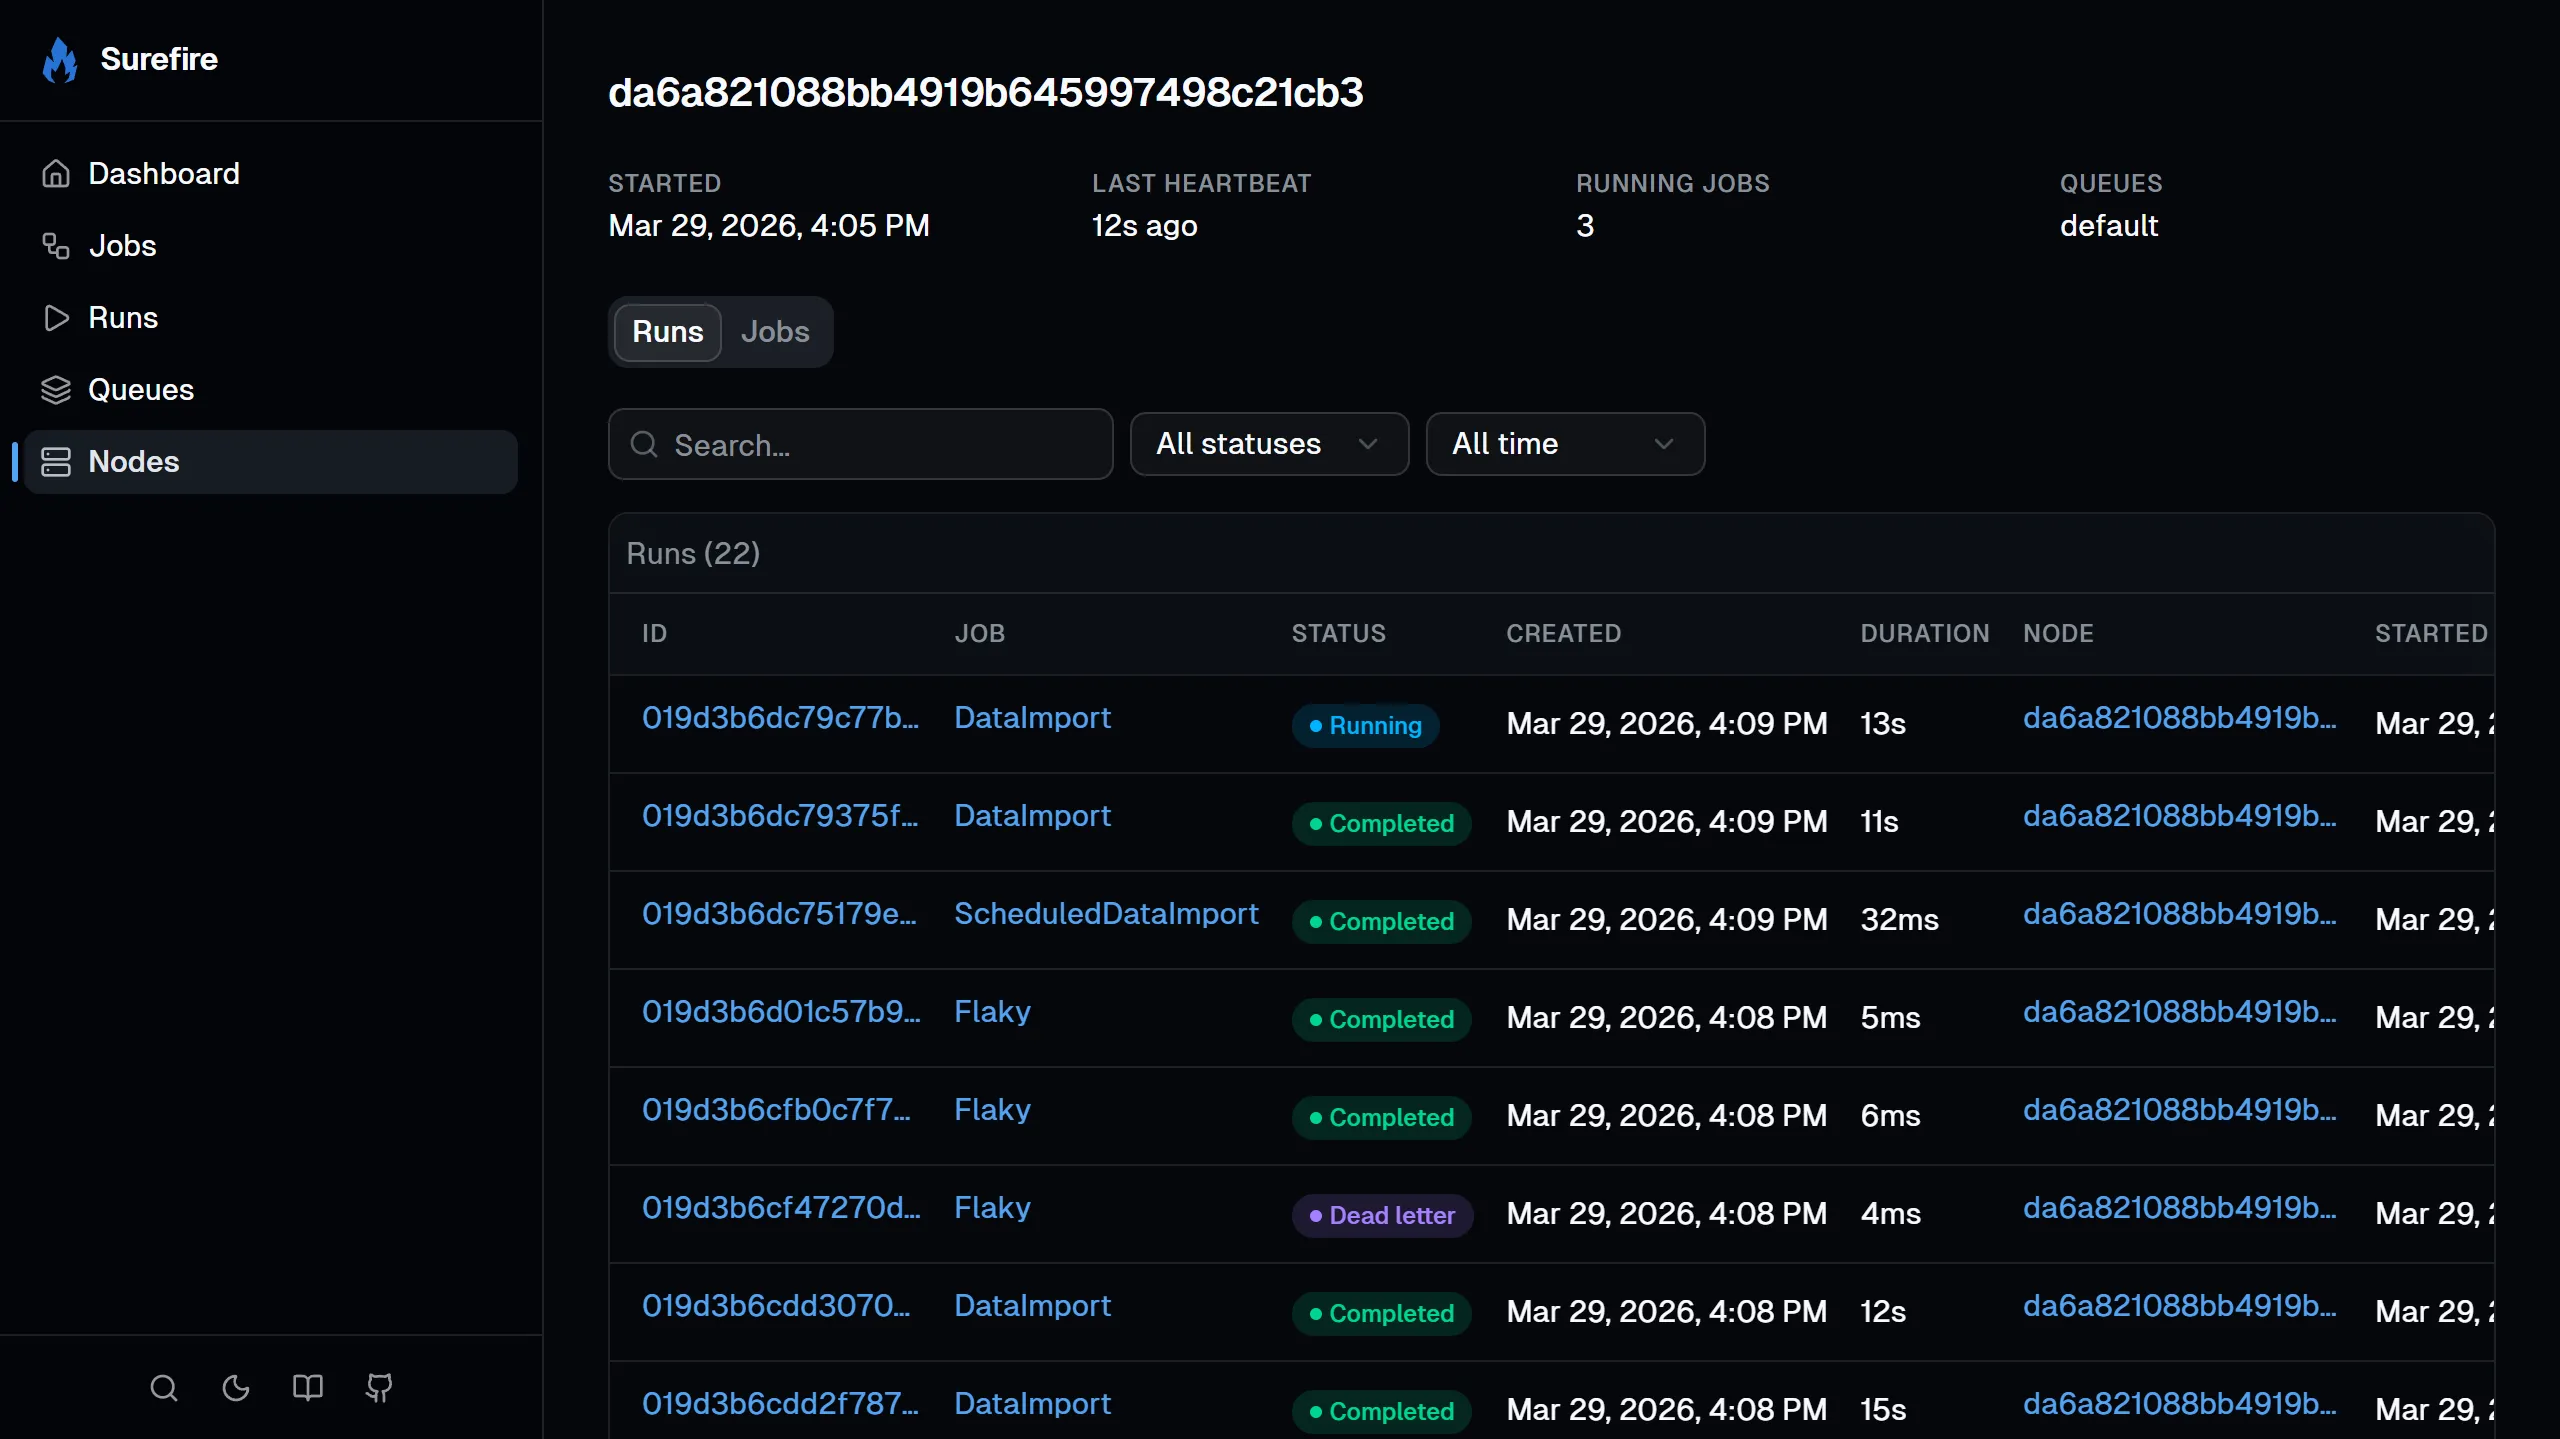
Lists all scheduler nodes with their last heartbeat, running job count, and registered jobs.
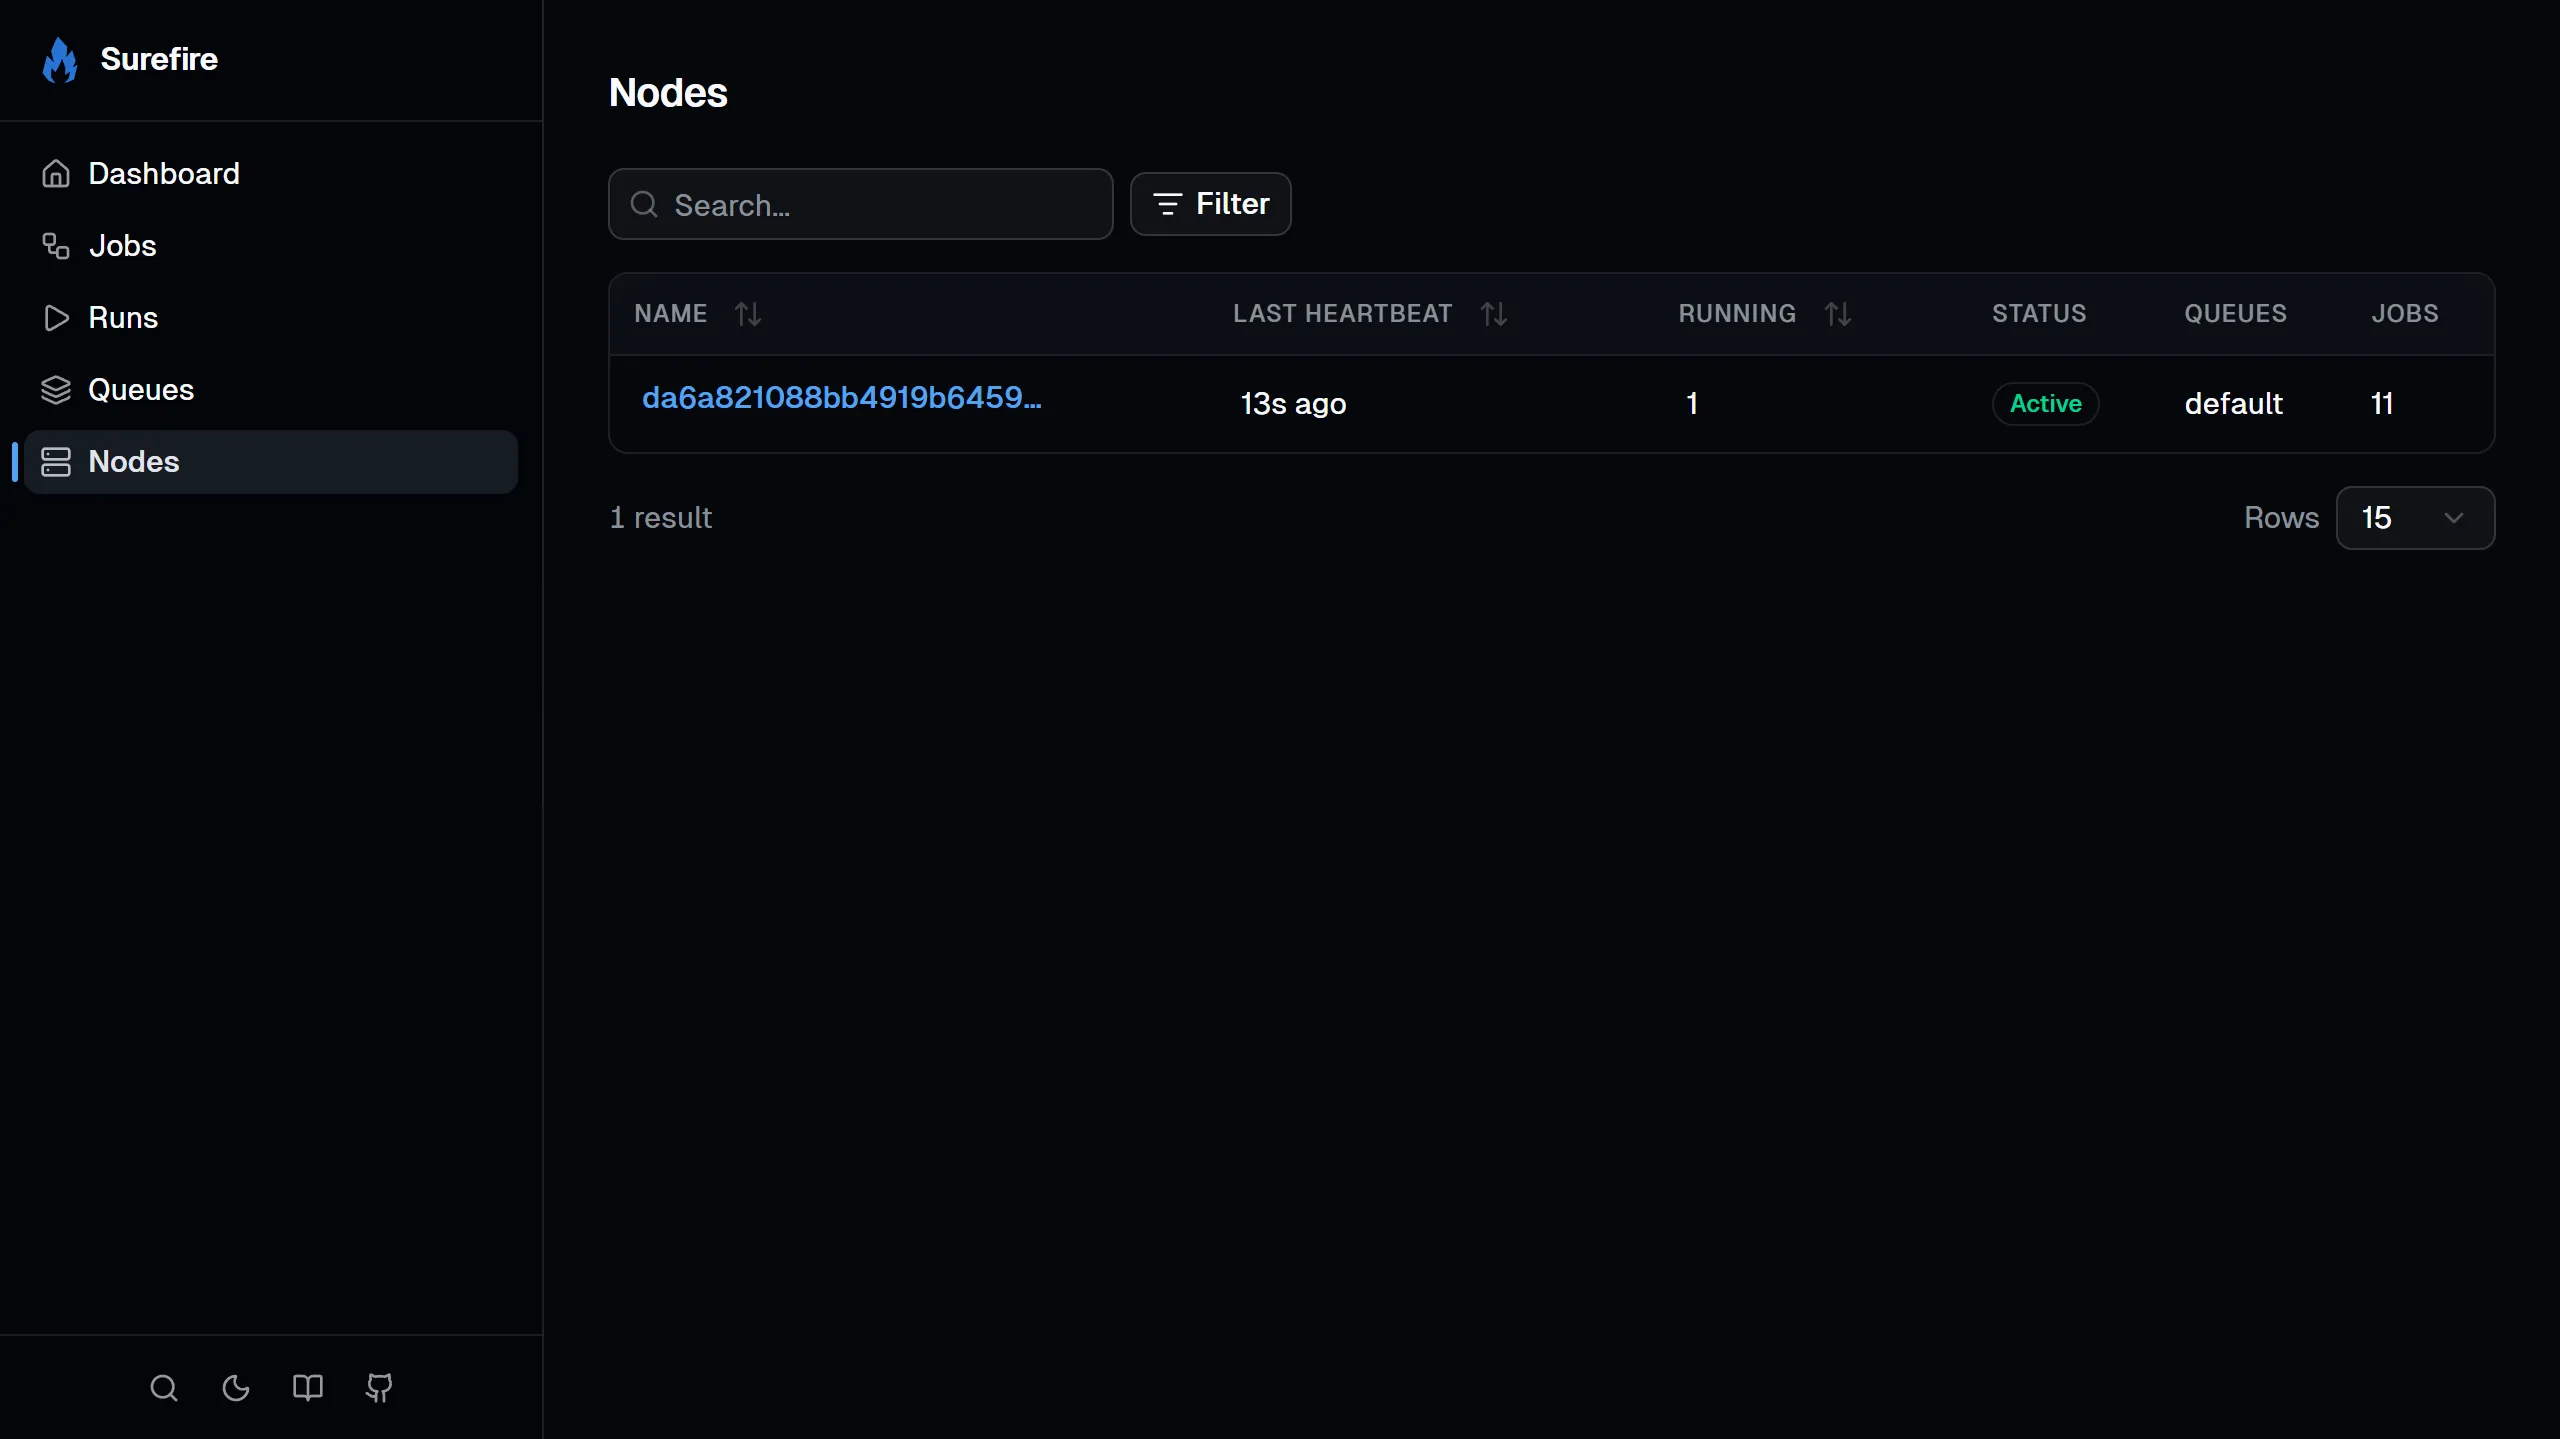
Click into a node to see what jobs it handles and its recent run history.
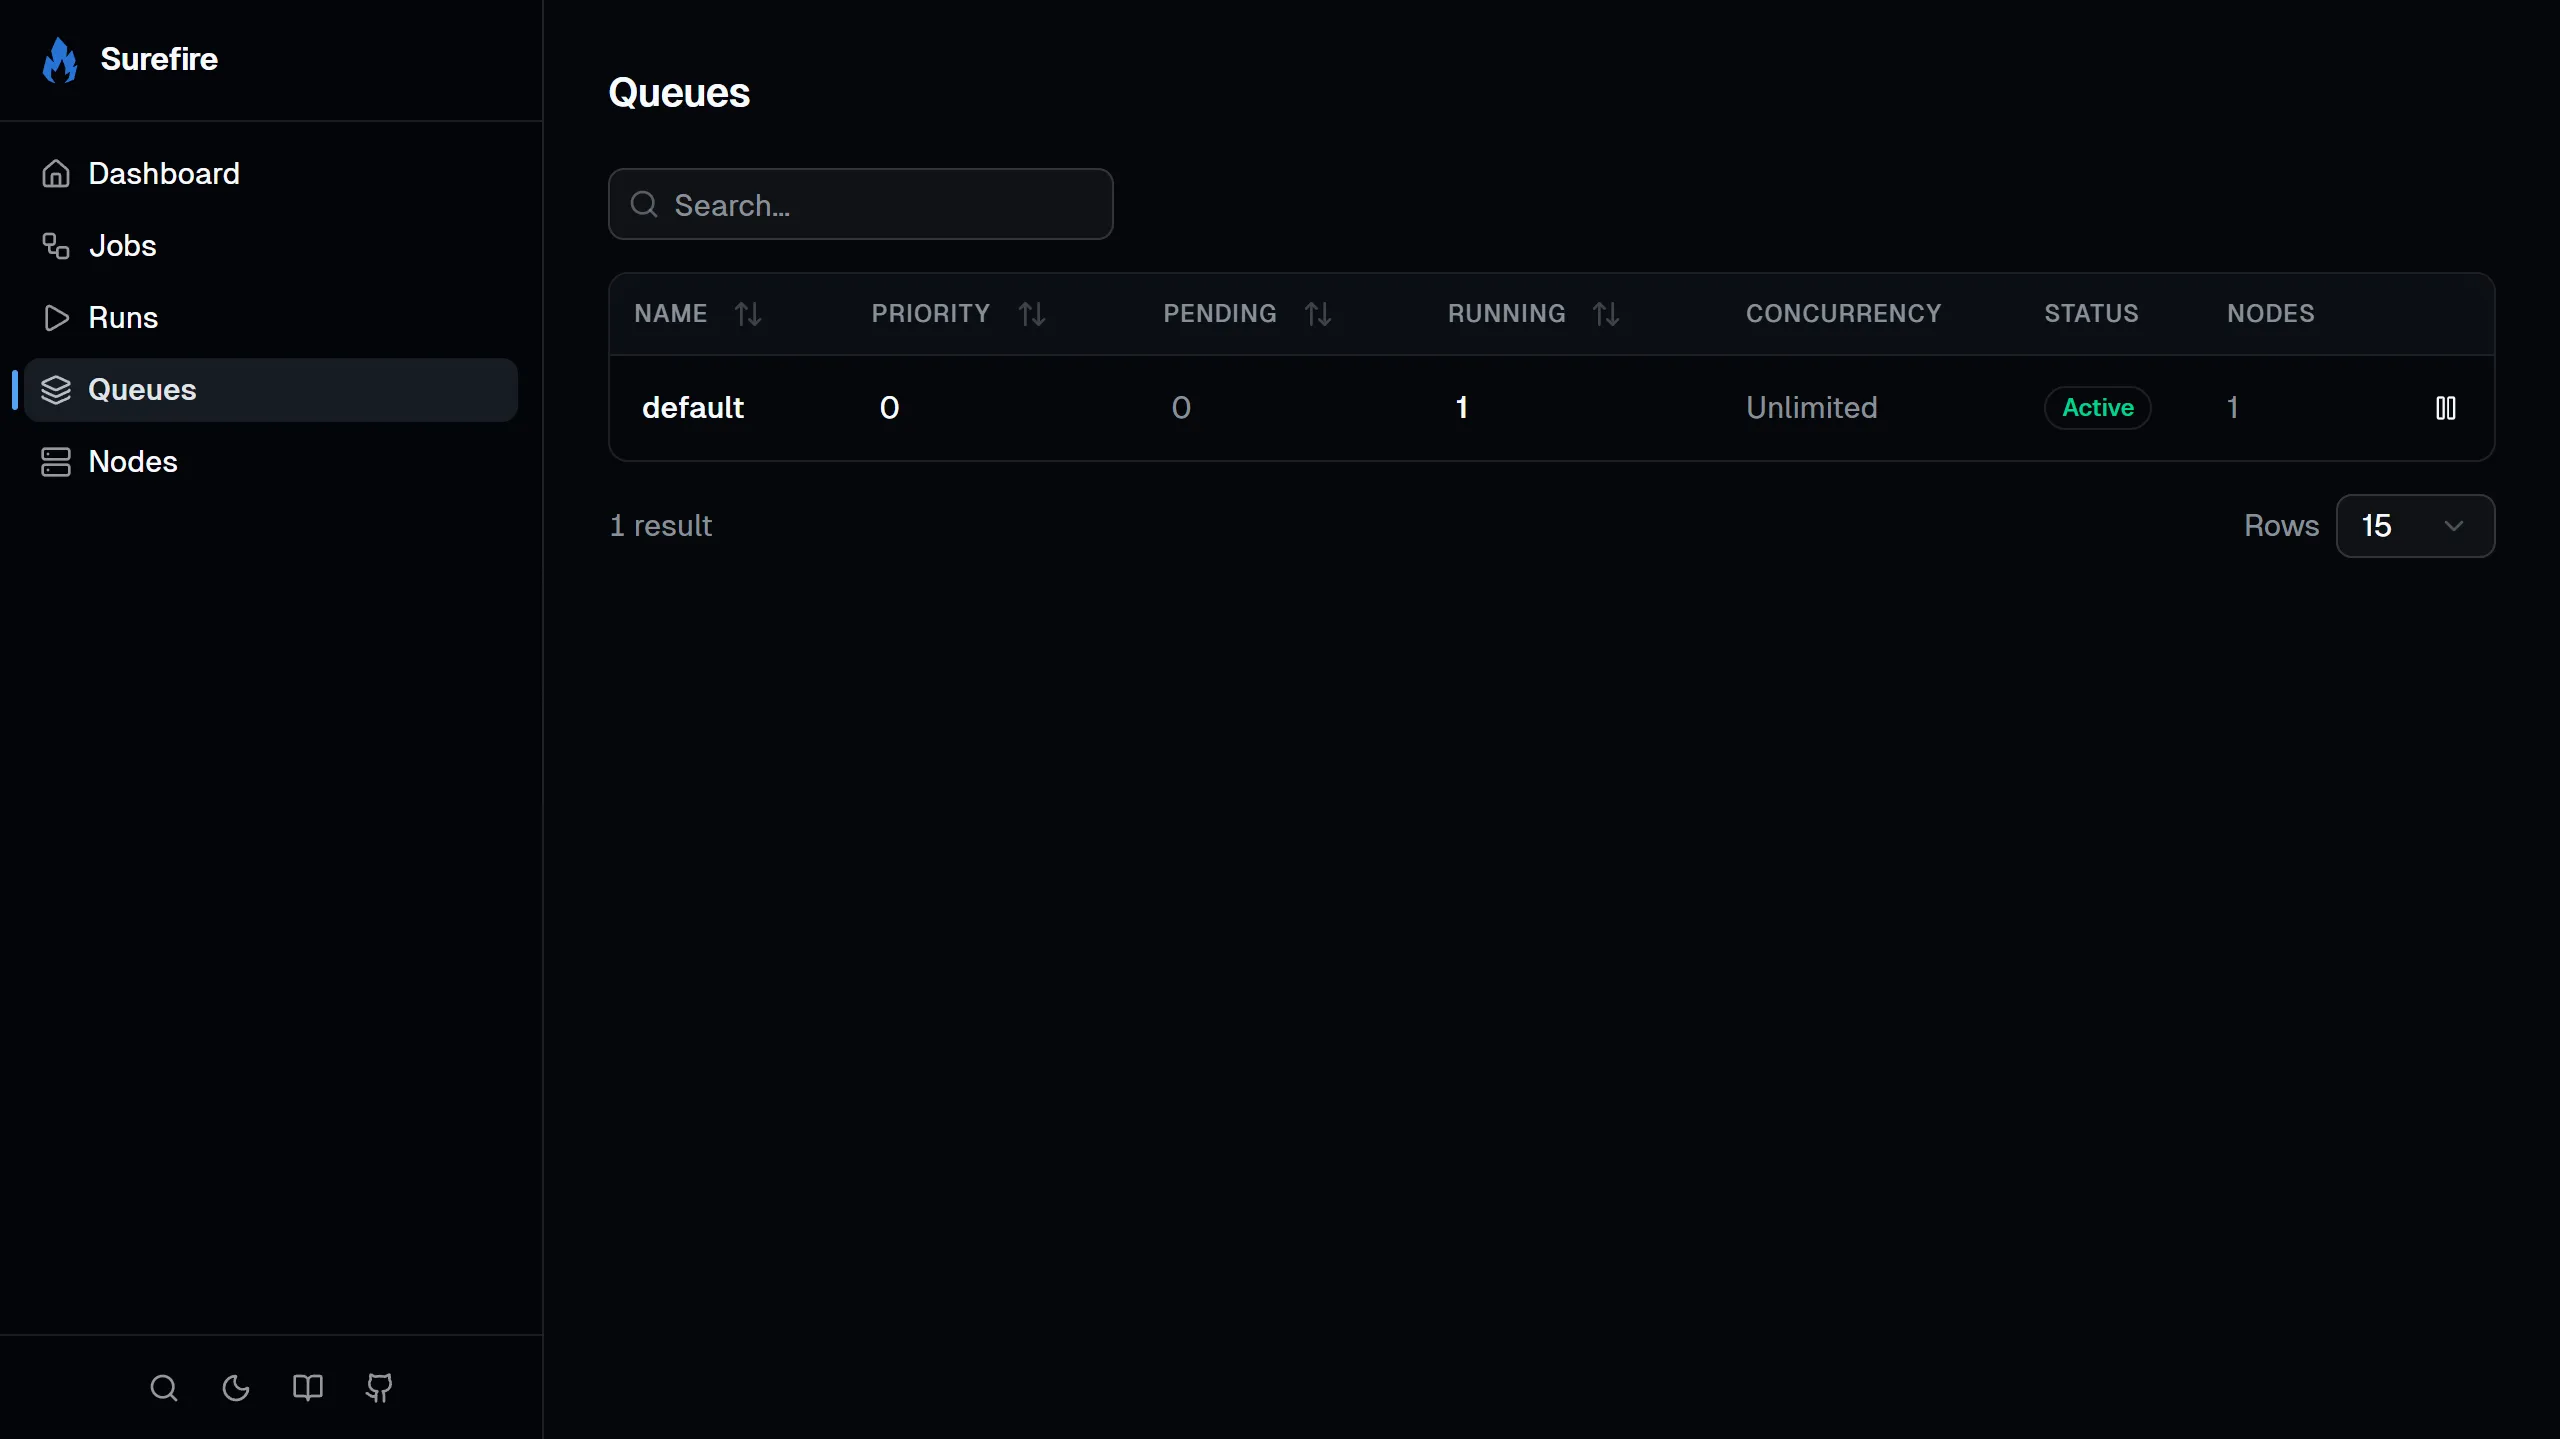
Queues
Section titled “Queues”Lists all queues with their pending run count, concurrency limits, and paused status. You can pause and resume queues from this page. See the queues concept page for more on how queues work.
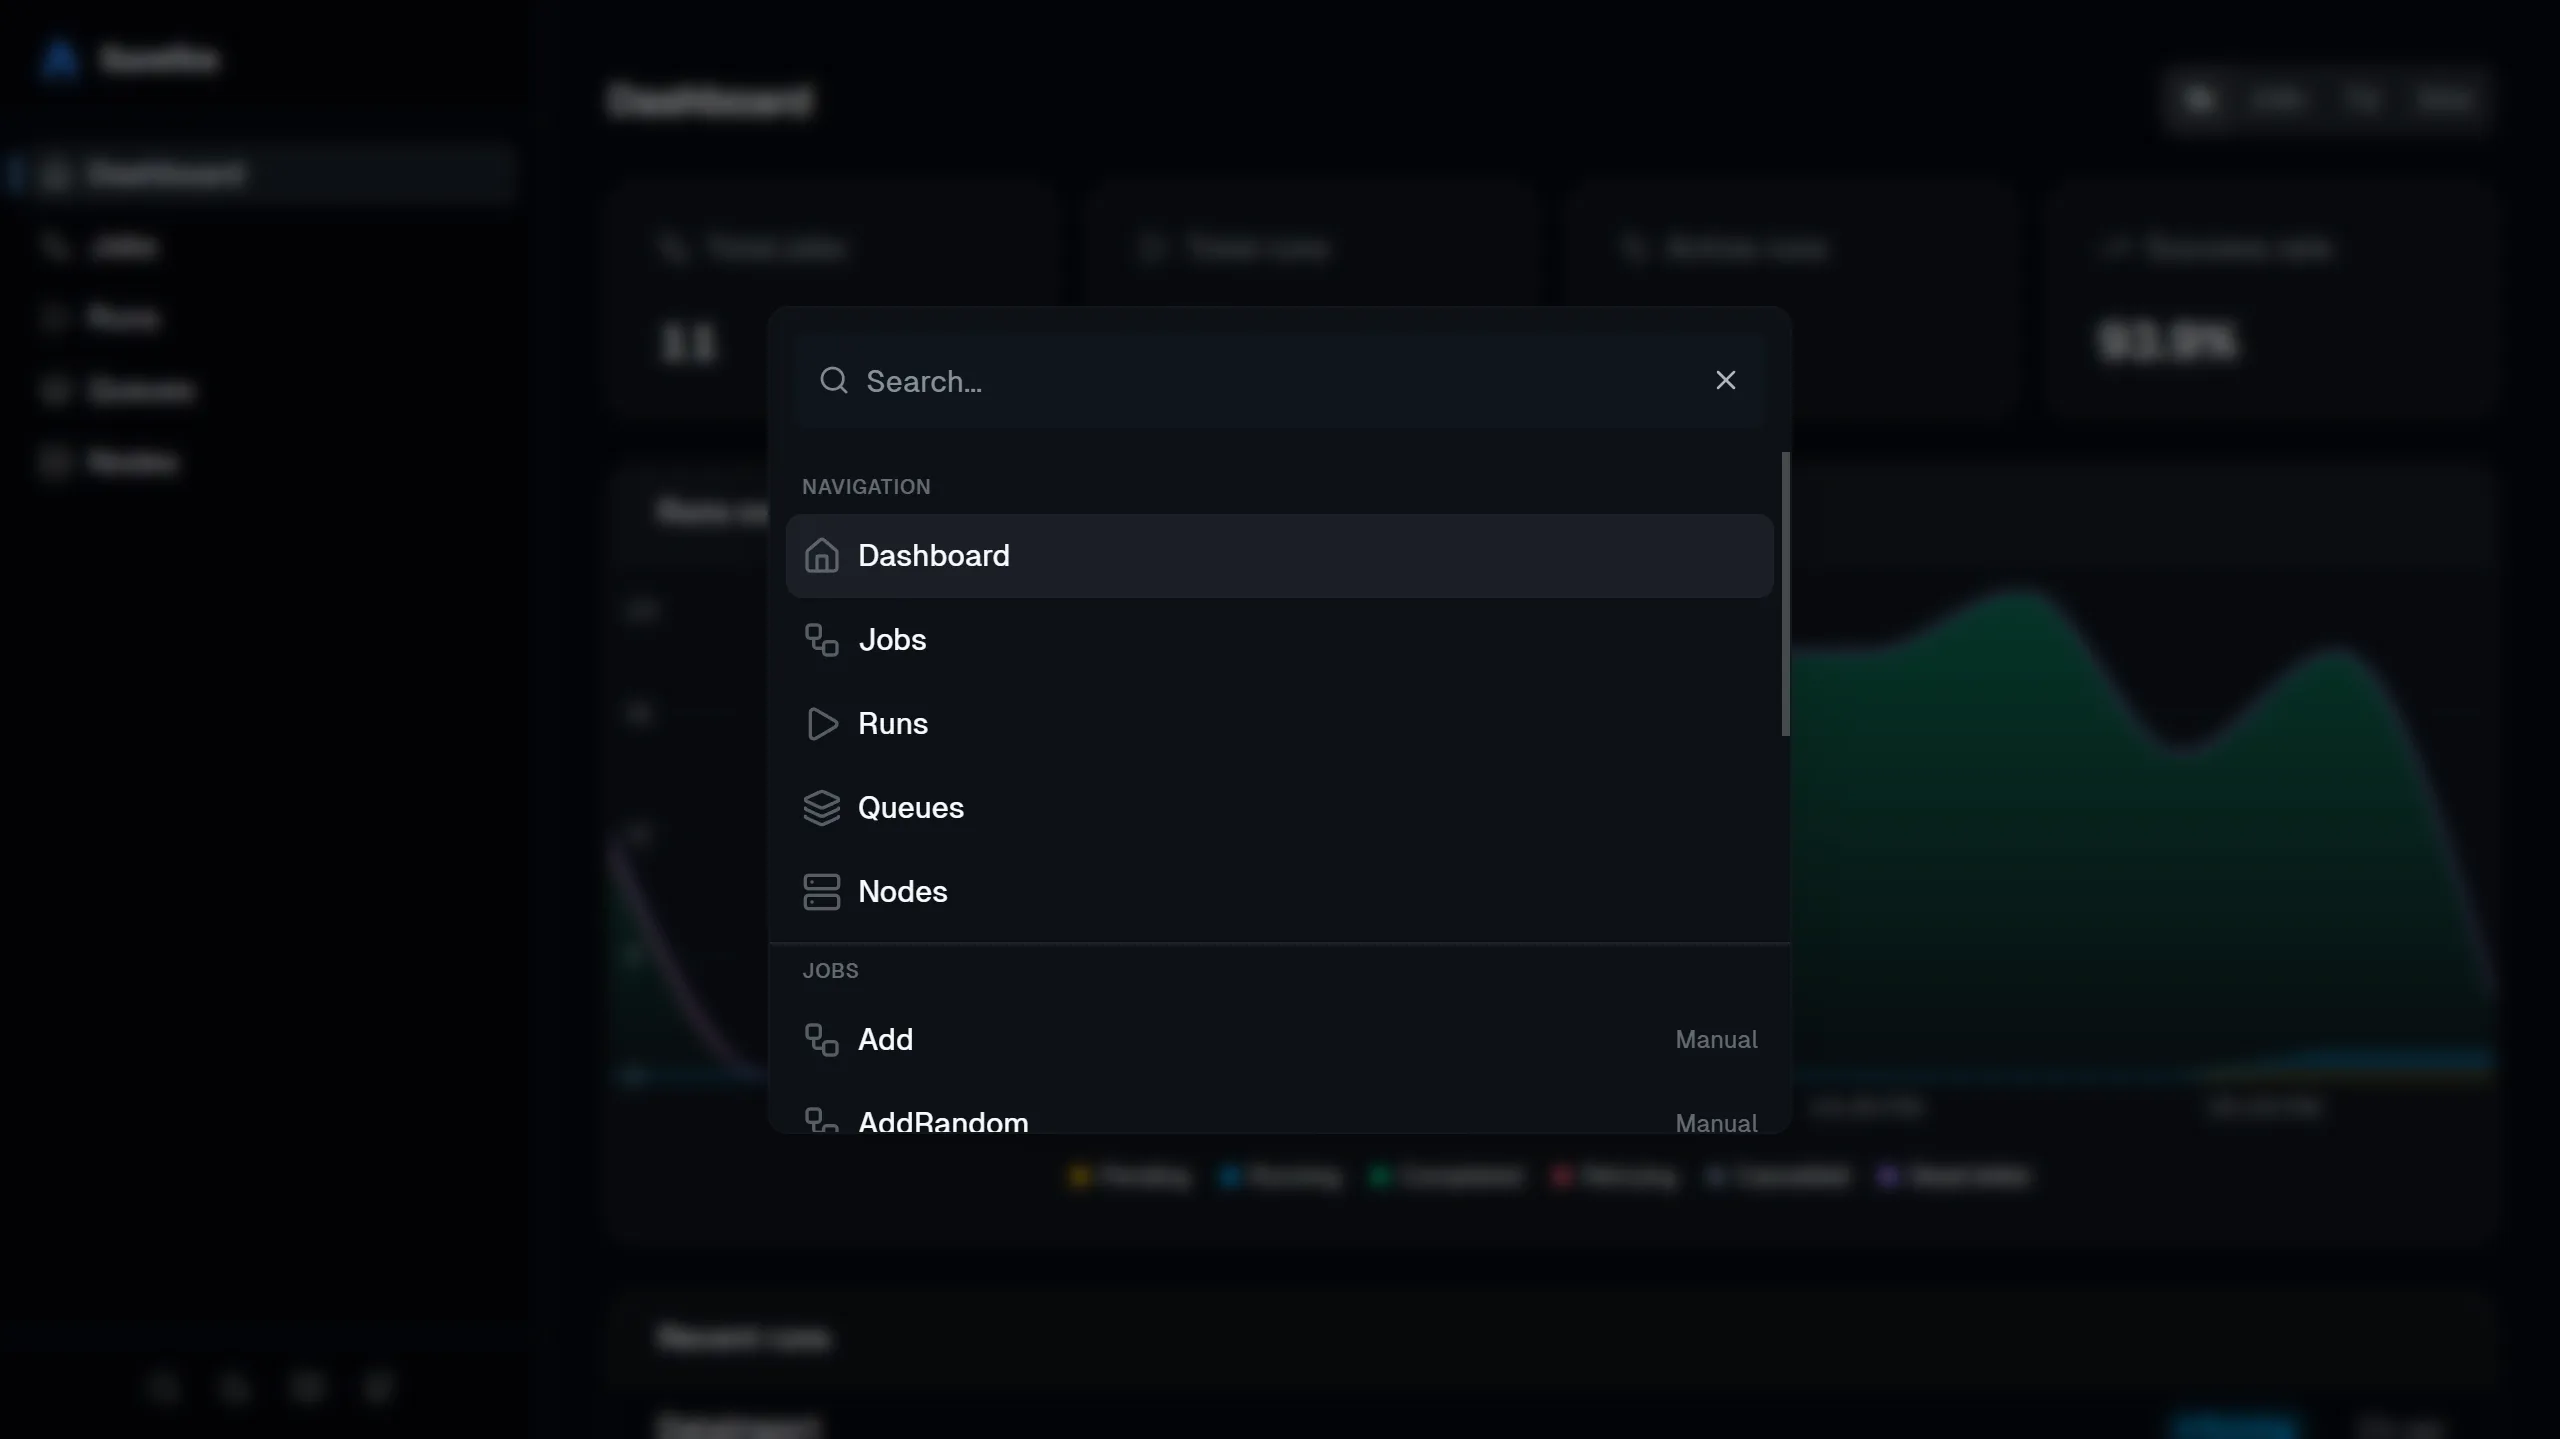
Command palette
Section titled “Command palette”Press / or Ctrl+K (⌘K on Mac) to open the command palette. Search for jobs, runs, or nodes and jump straight to them.
The dashboard also exposes a REST API at {prefix}/api/:
- Use it to query jobs and runs, stream run updates, and manage runs/queues.
GET /api/stats # dashboard statisticsGET /api/jobs # list all jobsGET /api/jobs/{name} # get a single jobGET /api/jobs/{name}/stats # get job-level statsPATCH /api/jobs/{name} # update a job (enable/disable)POST /api/jobs/{name}/trigger # trigger a new runGET /api/runs?jobName=X&take=20 # list runs with filtersGET /api/runs/{id} # get a single runGET /api/runs/{id}/logs # get parsed log eventsGET /api/runs/{id}/stream # live logs & progress (SSE)GET /api/runs/{id}/trace # get the trace tree for a runPOST /api/runs/{id}/cancel # cancel a running jobPOST /api/runs/{id}/rerun # re-run a completed runGET /api/queues # list all queuesPATCH /api/queues/{name} # update a queue (pause/resume)GET /api/nodes # list all nodesGET /api/nodes/{name} # get a single node