
Dashboard
builder.Services.AddSurefireDashboard();// ...app.MapSurefireDashboard(); // at /surefireapp.MapSurefireDashboard("/admin"); // custom prefixThe dashboard is embedded in the Surefire.Dashboard package, with no extra files or build steps.
Pass a configure callback to override defaults:
builder.Services.AddSurefireDashboard(options =>{ options.MaxTreeRuns = 100_000; // cap the run tree response (default: 50_000)});Authorization
Section titled “Authorization”Anyone who can reach the dashboard can view job arguments and results, trigger jobs, cancel runs, rerun completed work, and pause queues.
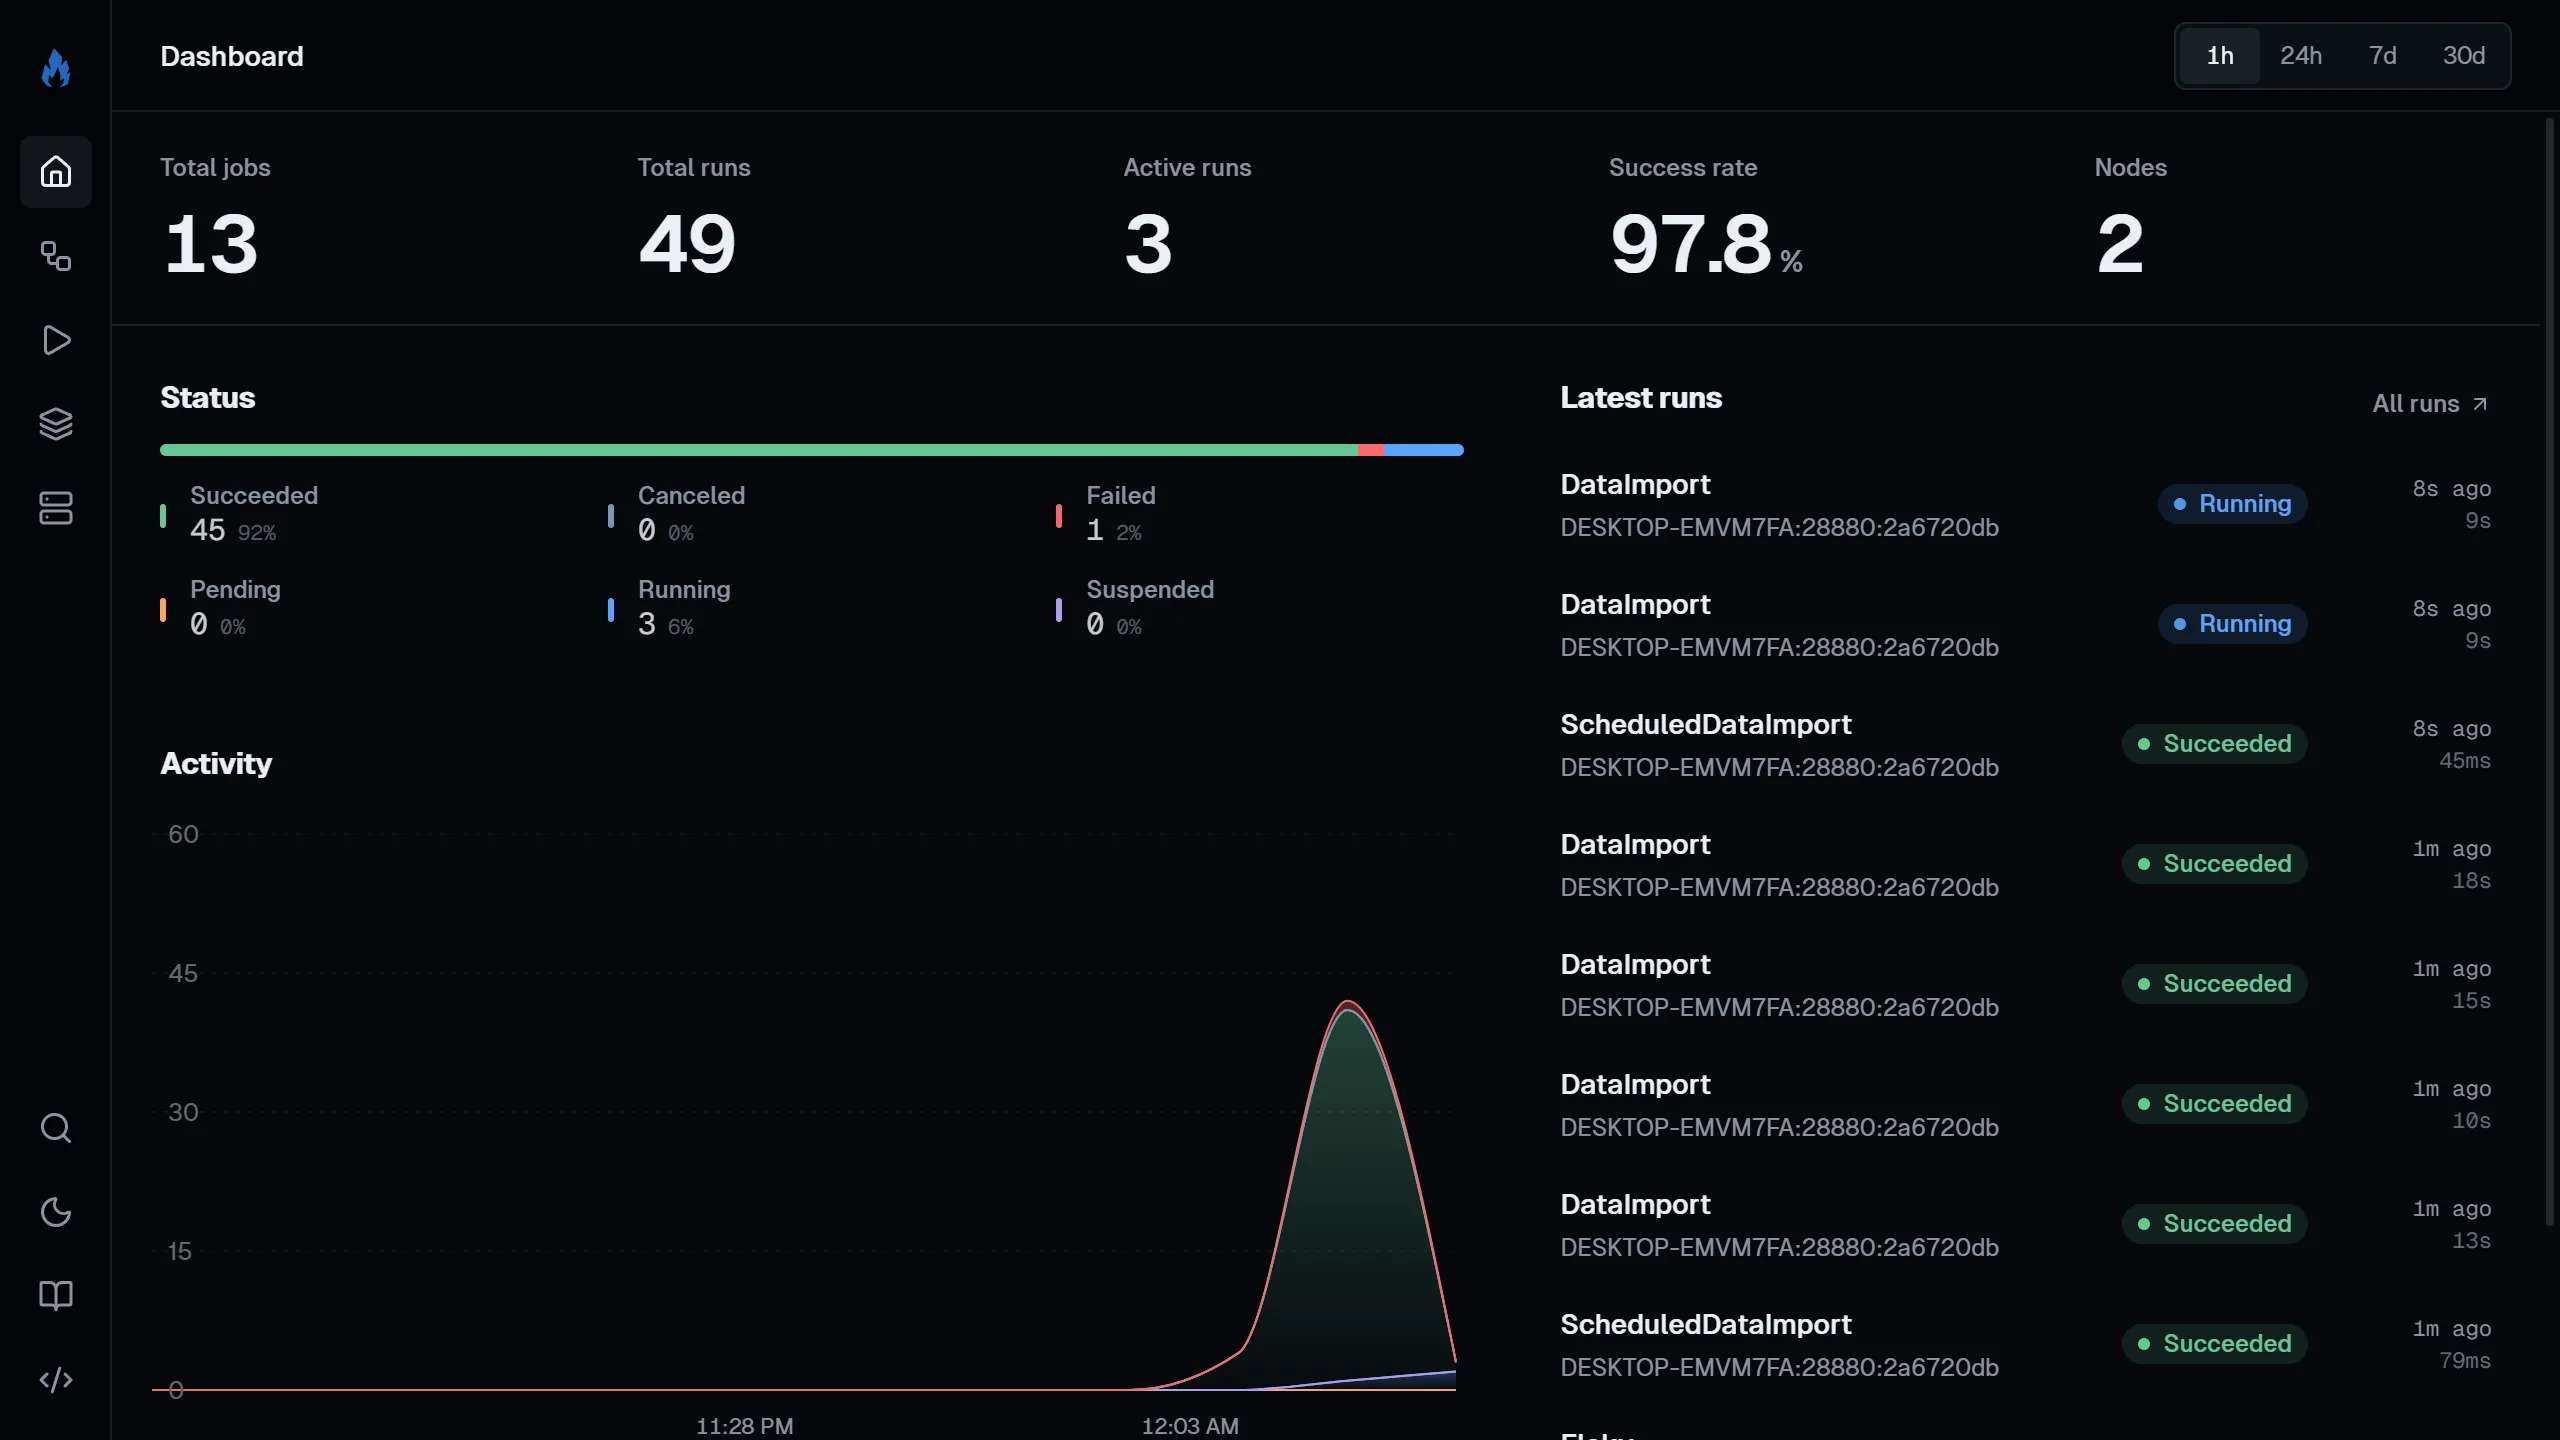
app.MapSurefireDashboard() .RequireAuthorization("AdminPolicy");The home page gives you a quick overview:
- Stat cards: total jobs, total runs, active runs, success rate, and nodes.
- Status: a stacked bar showing the share of runs by status.
- Activity: a stacked area chart of runs by status over time.
- Latest runs: the most recent runs with status badges.
Use the period selector in the top bar to scope Status and Activity to 1h, 24h, 7d, or 30d.
Lists all registered jobs with their name, description, cron schedule, enabled/disabled status, and tags.
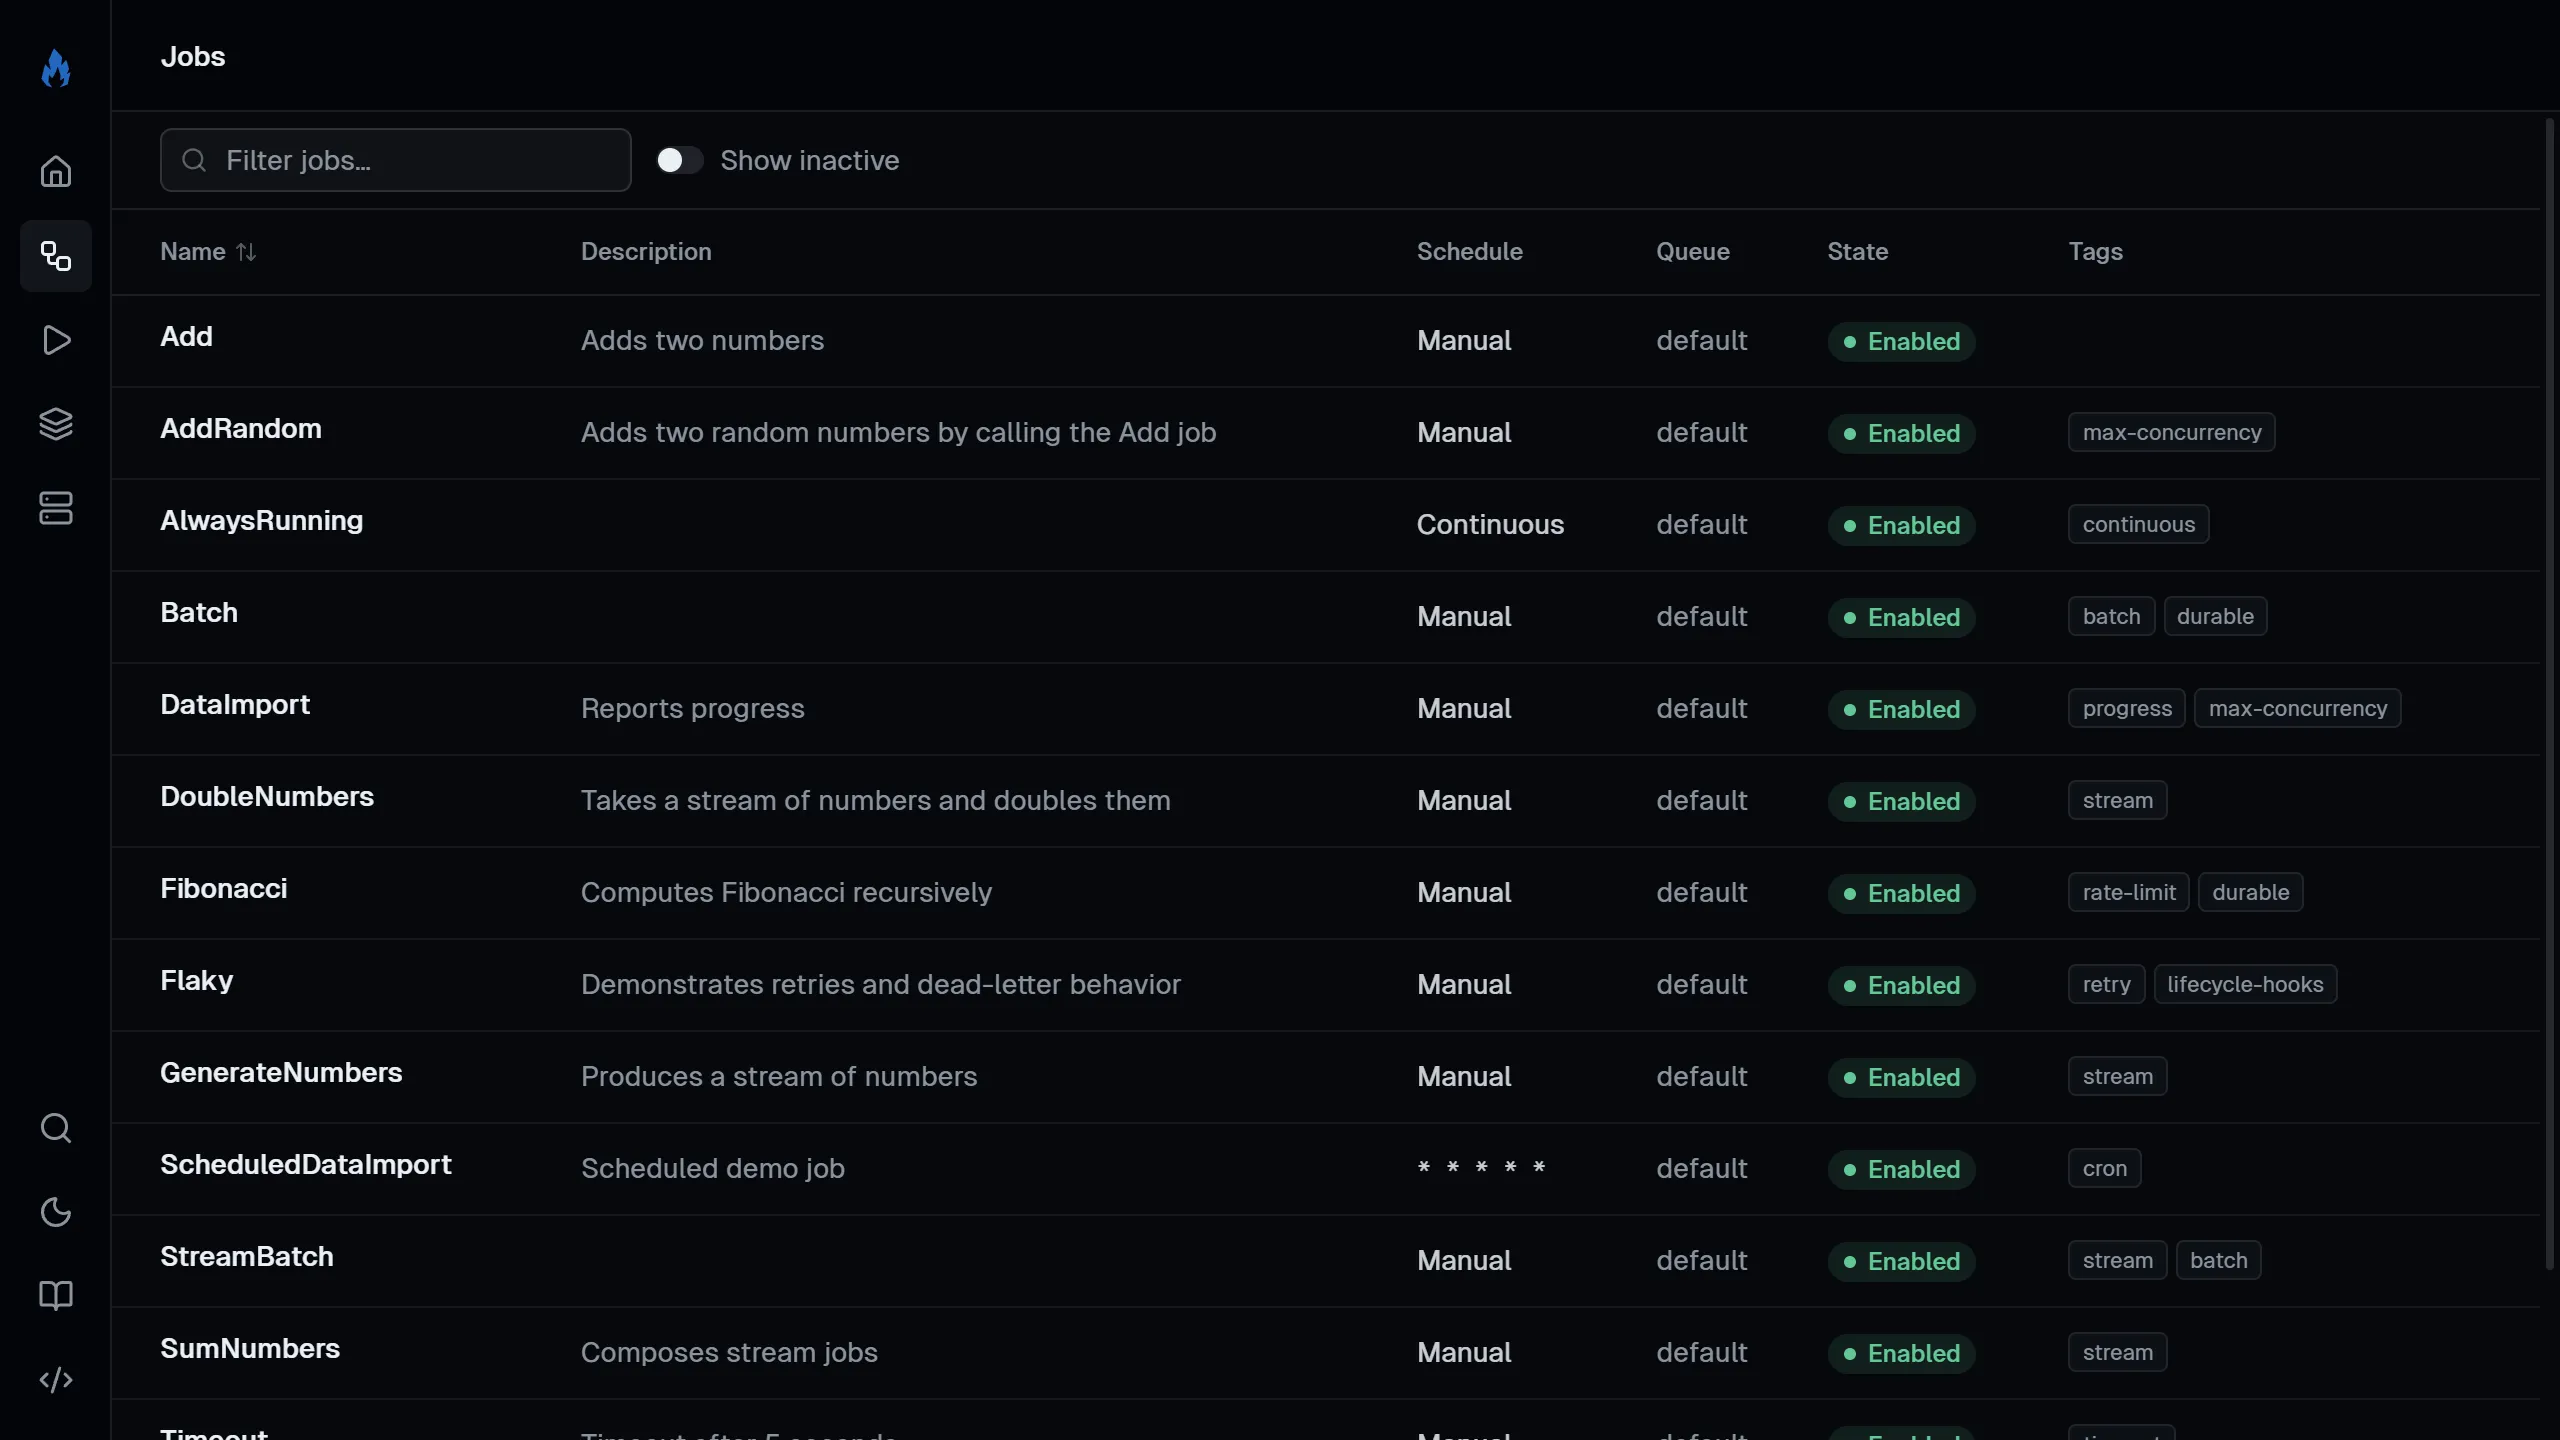
Click into a job to:
- Enable or disable it (disabling stops cron scheduling).
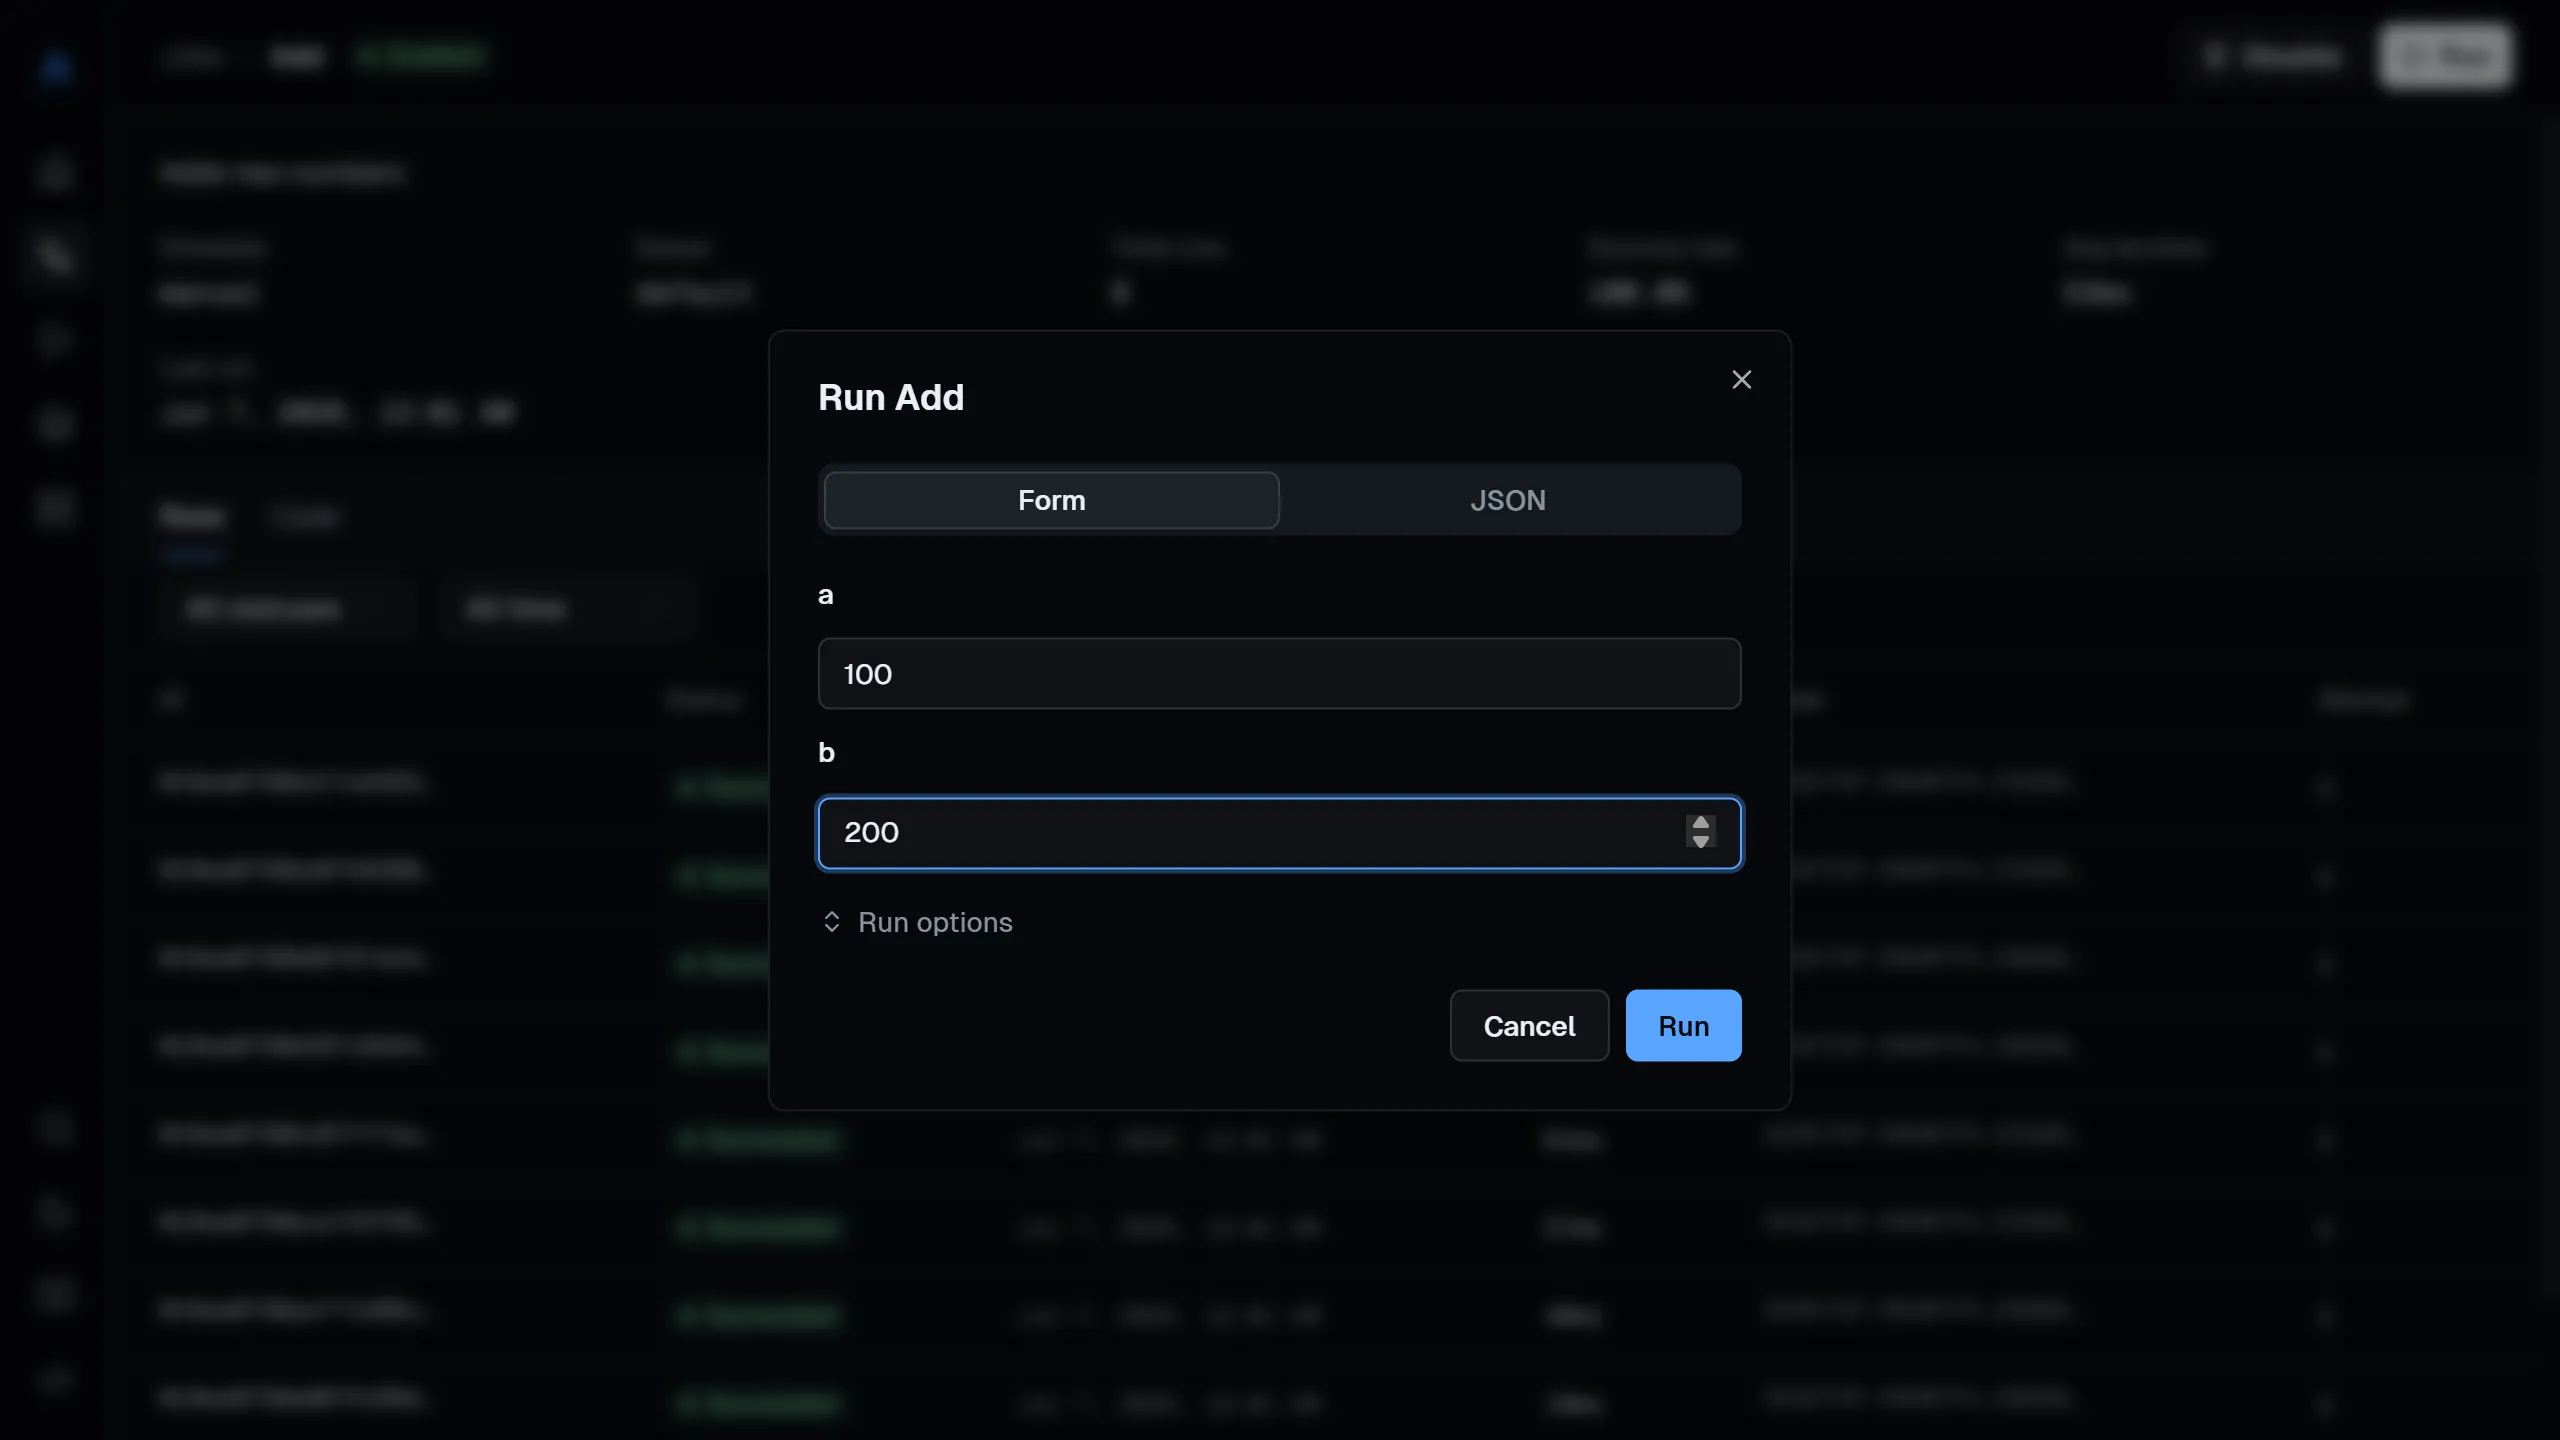
- Trigger a run with optional JSON arguments, a scheduled start time, and priority.
- See the job’s run history with pagination.
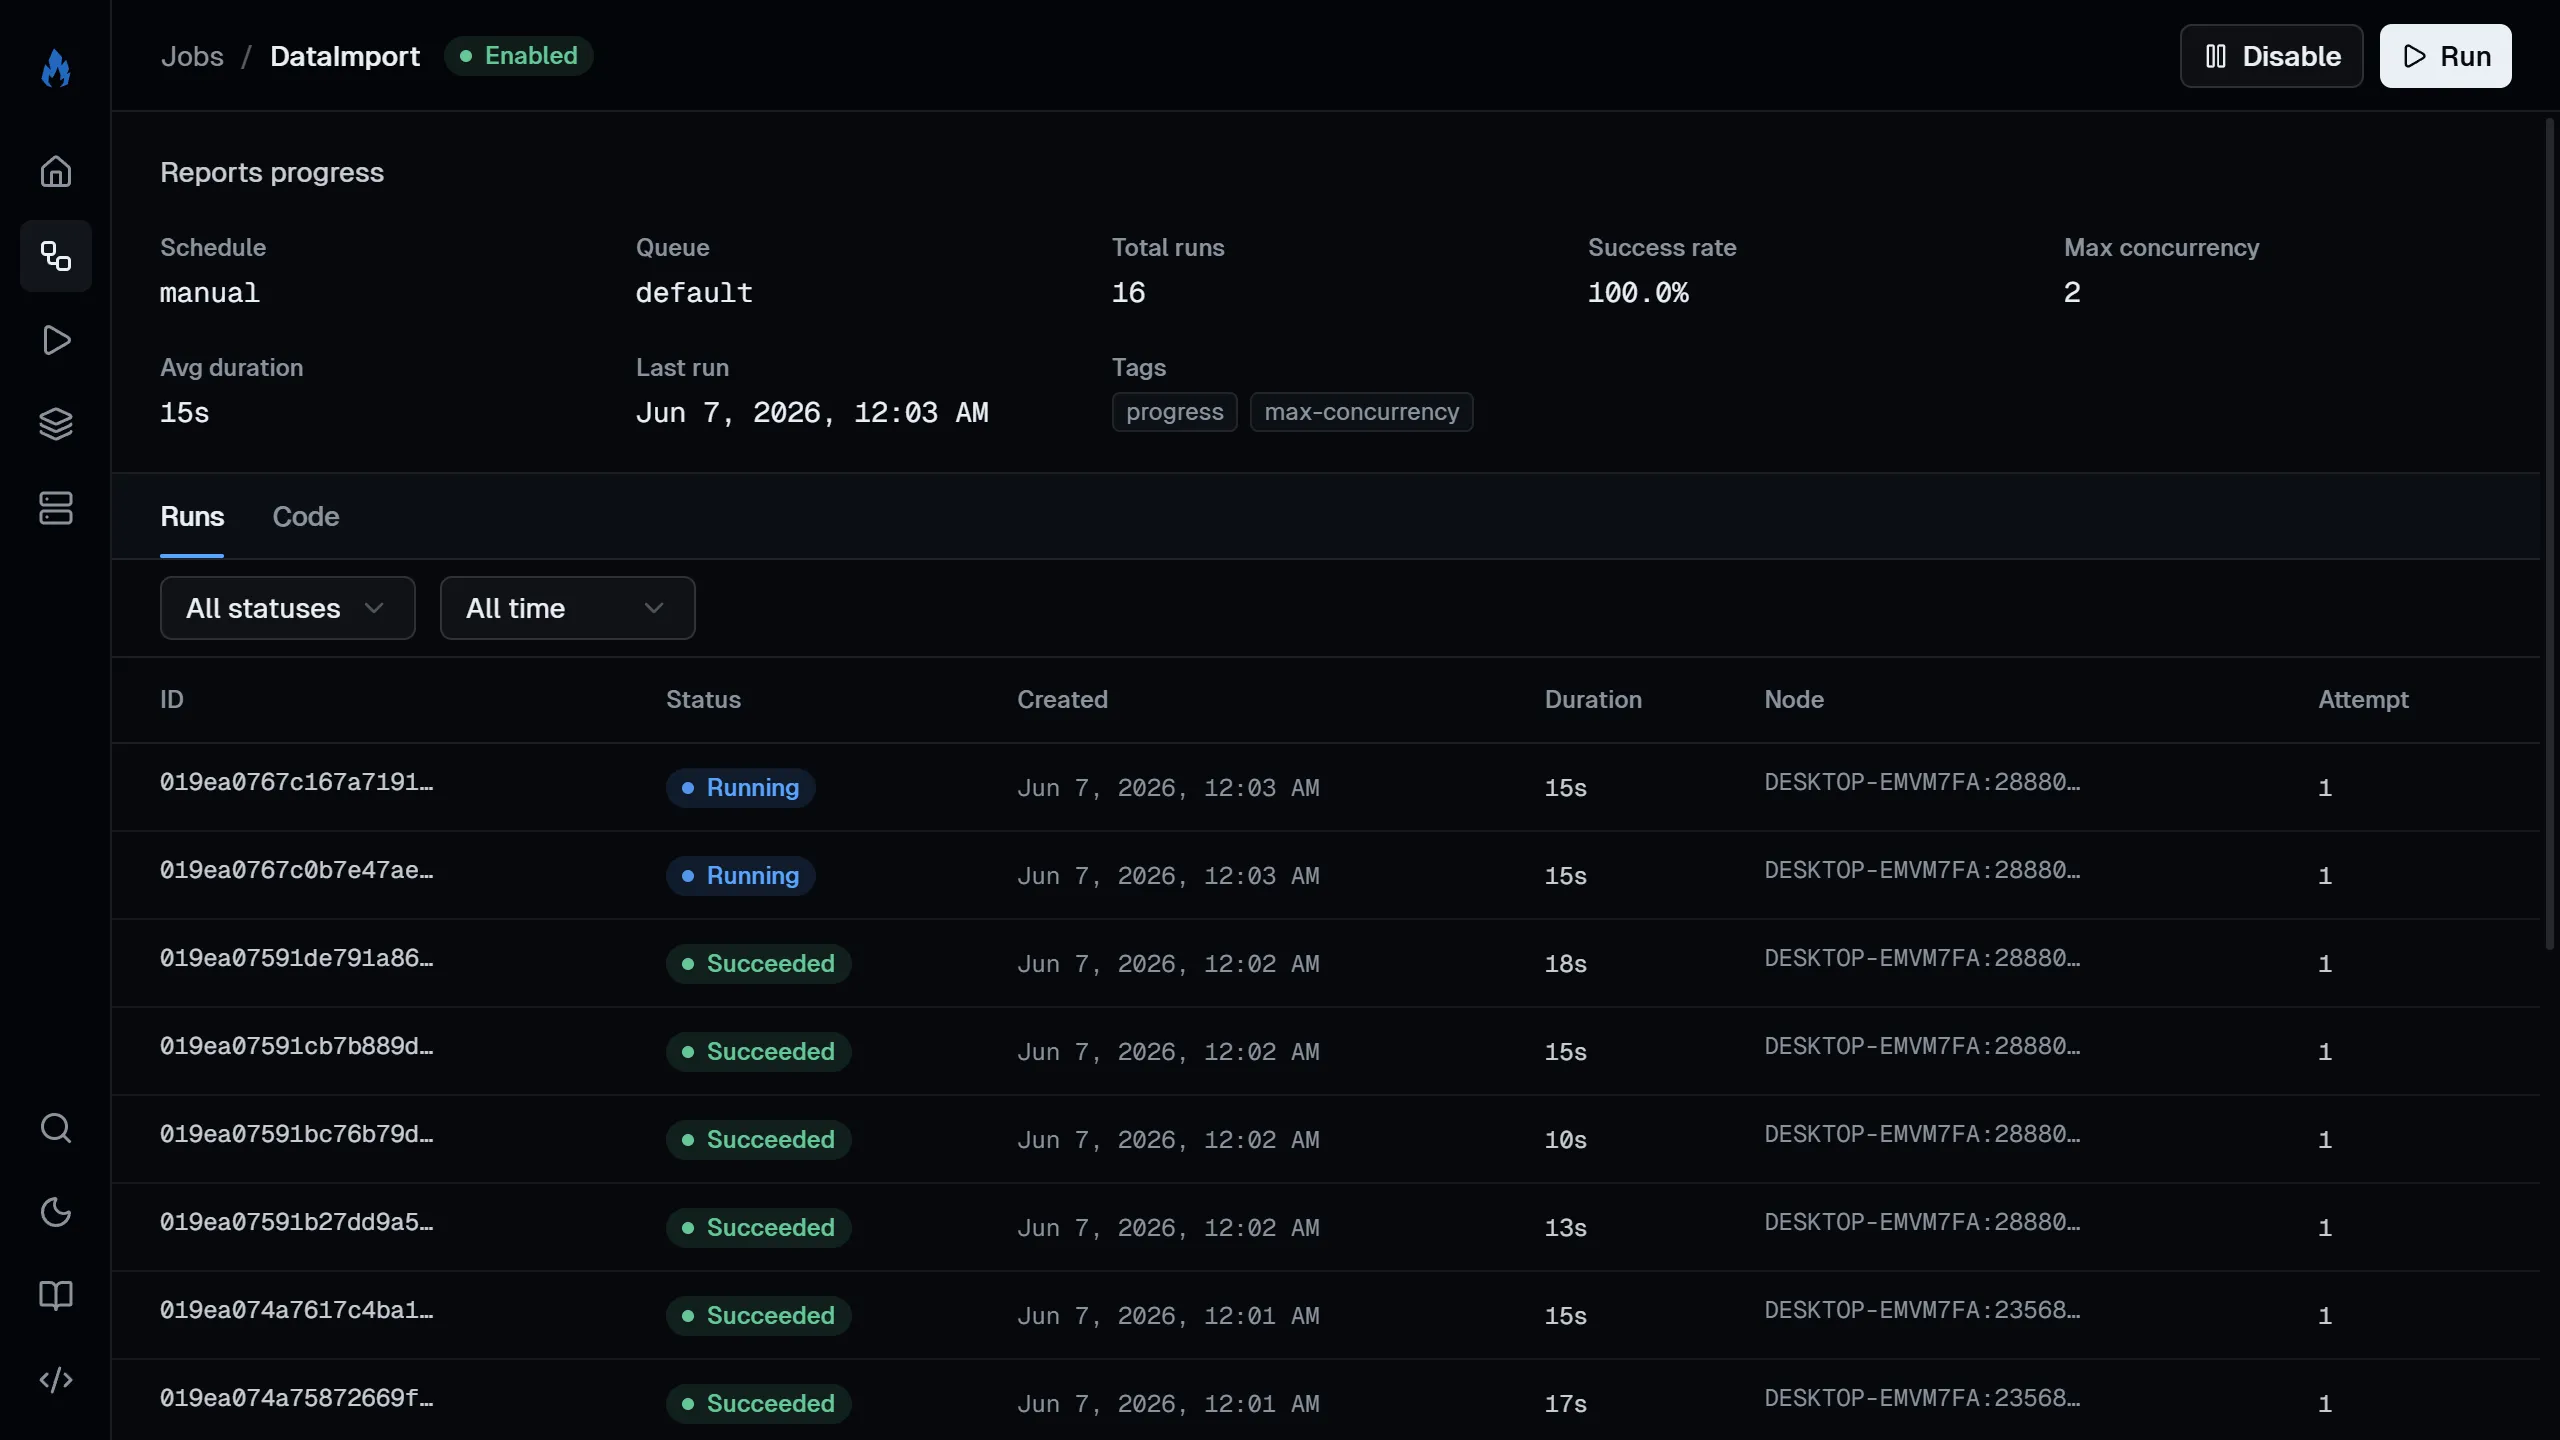
Lists all runs with filters for job name, status, and date range.
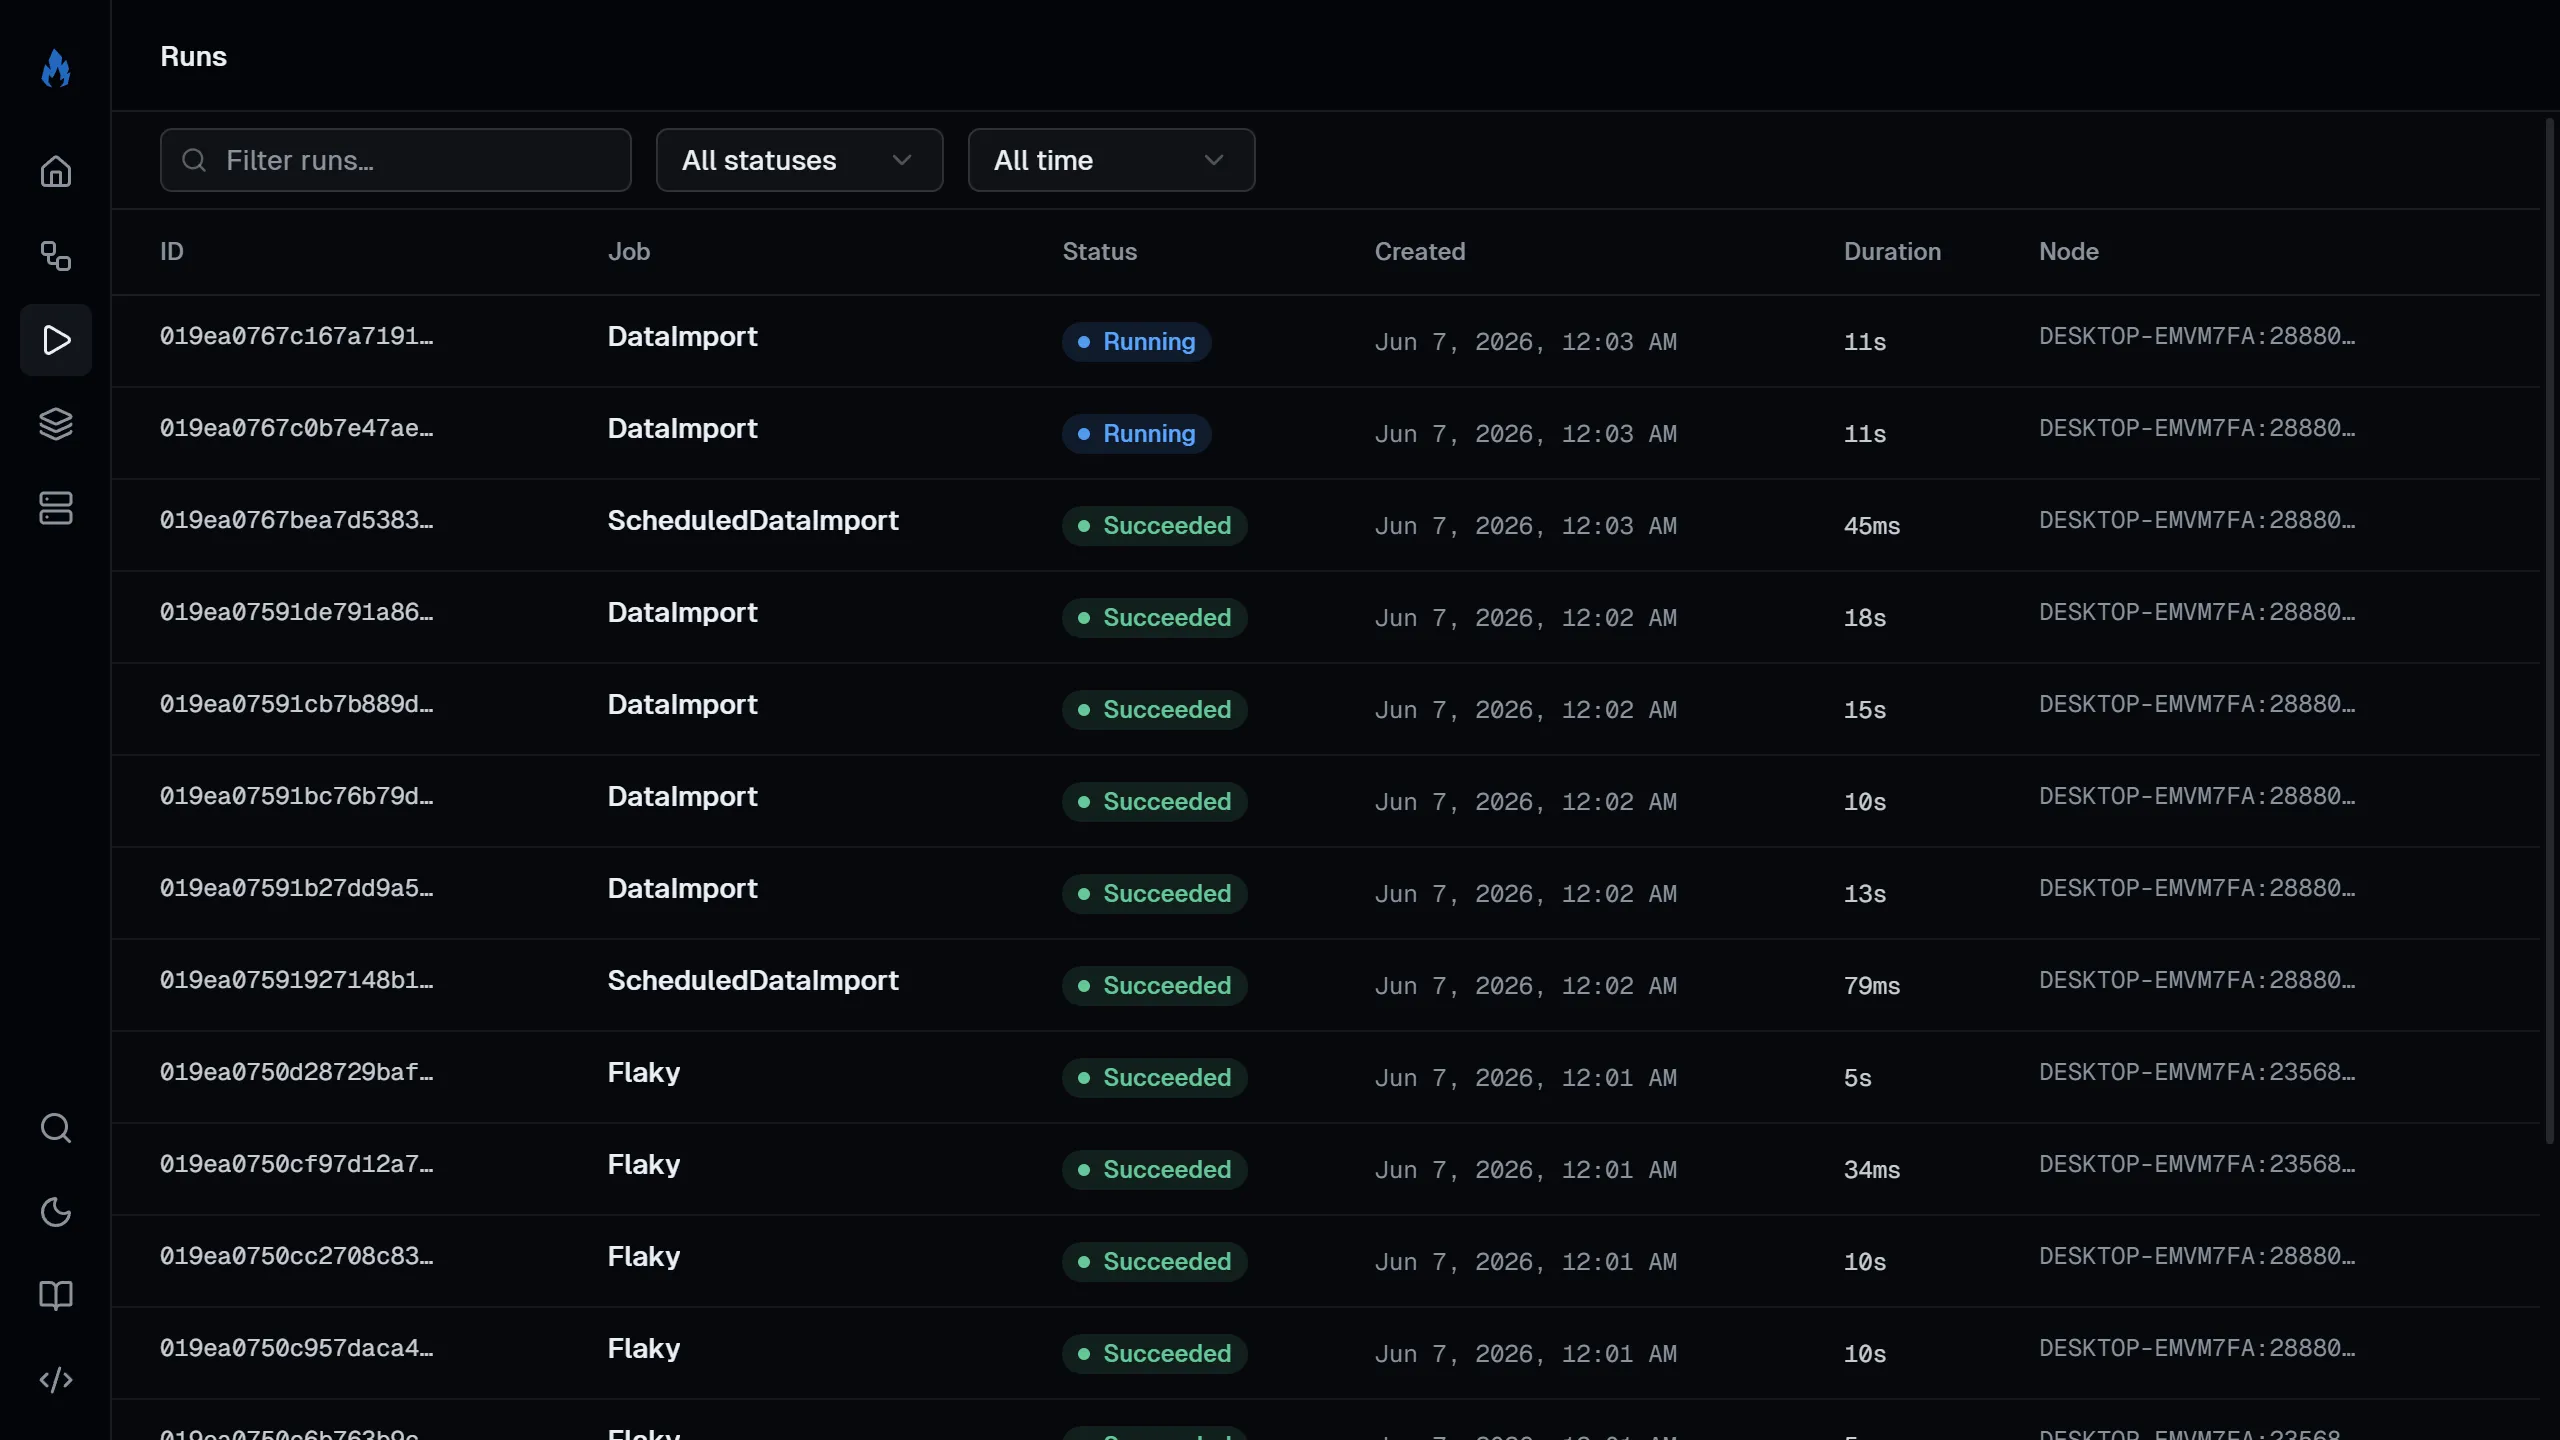
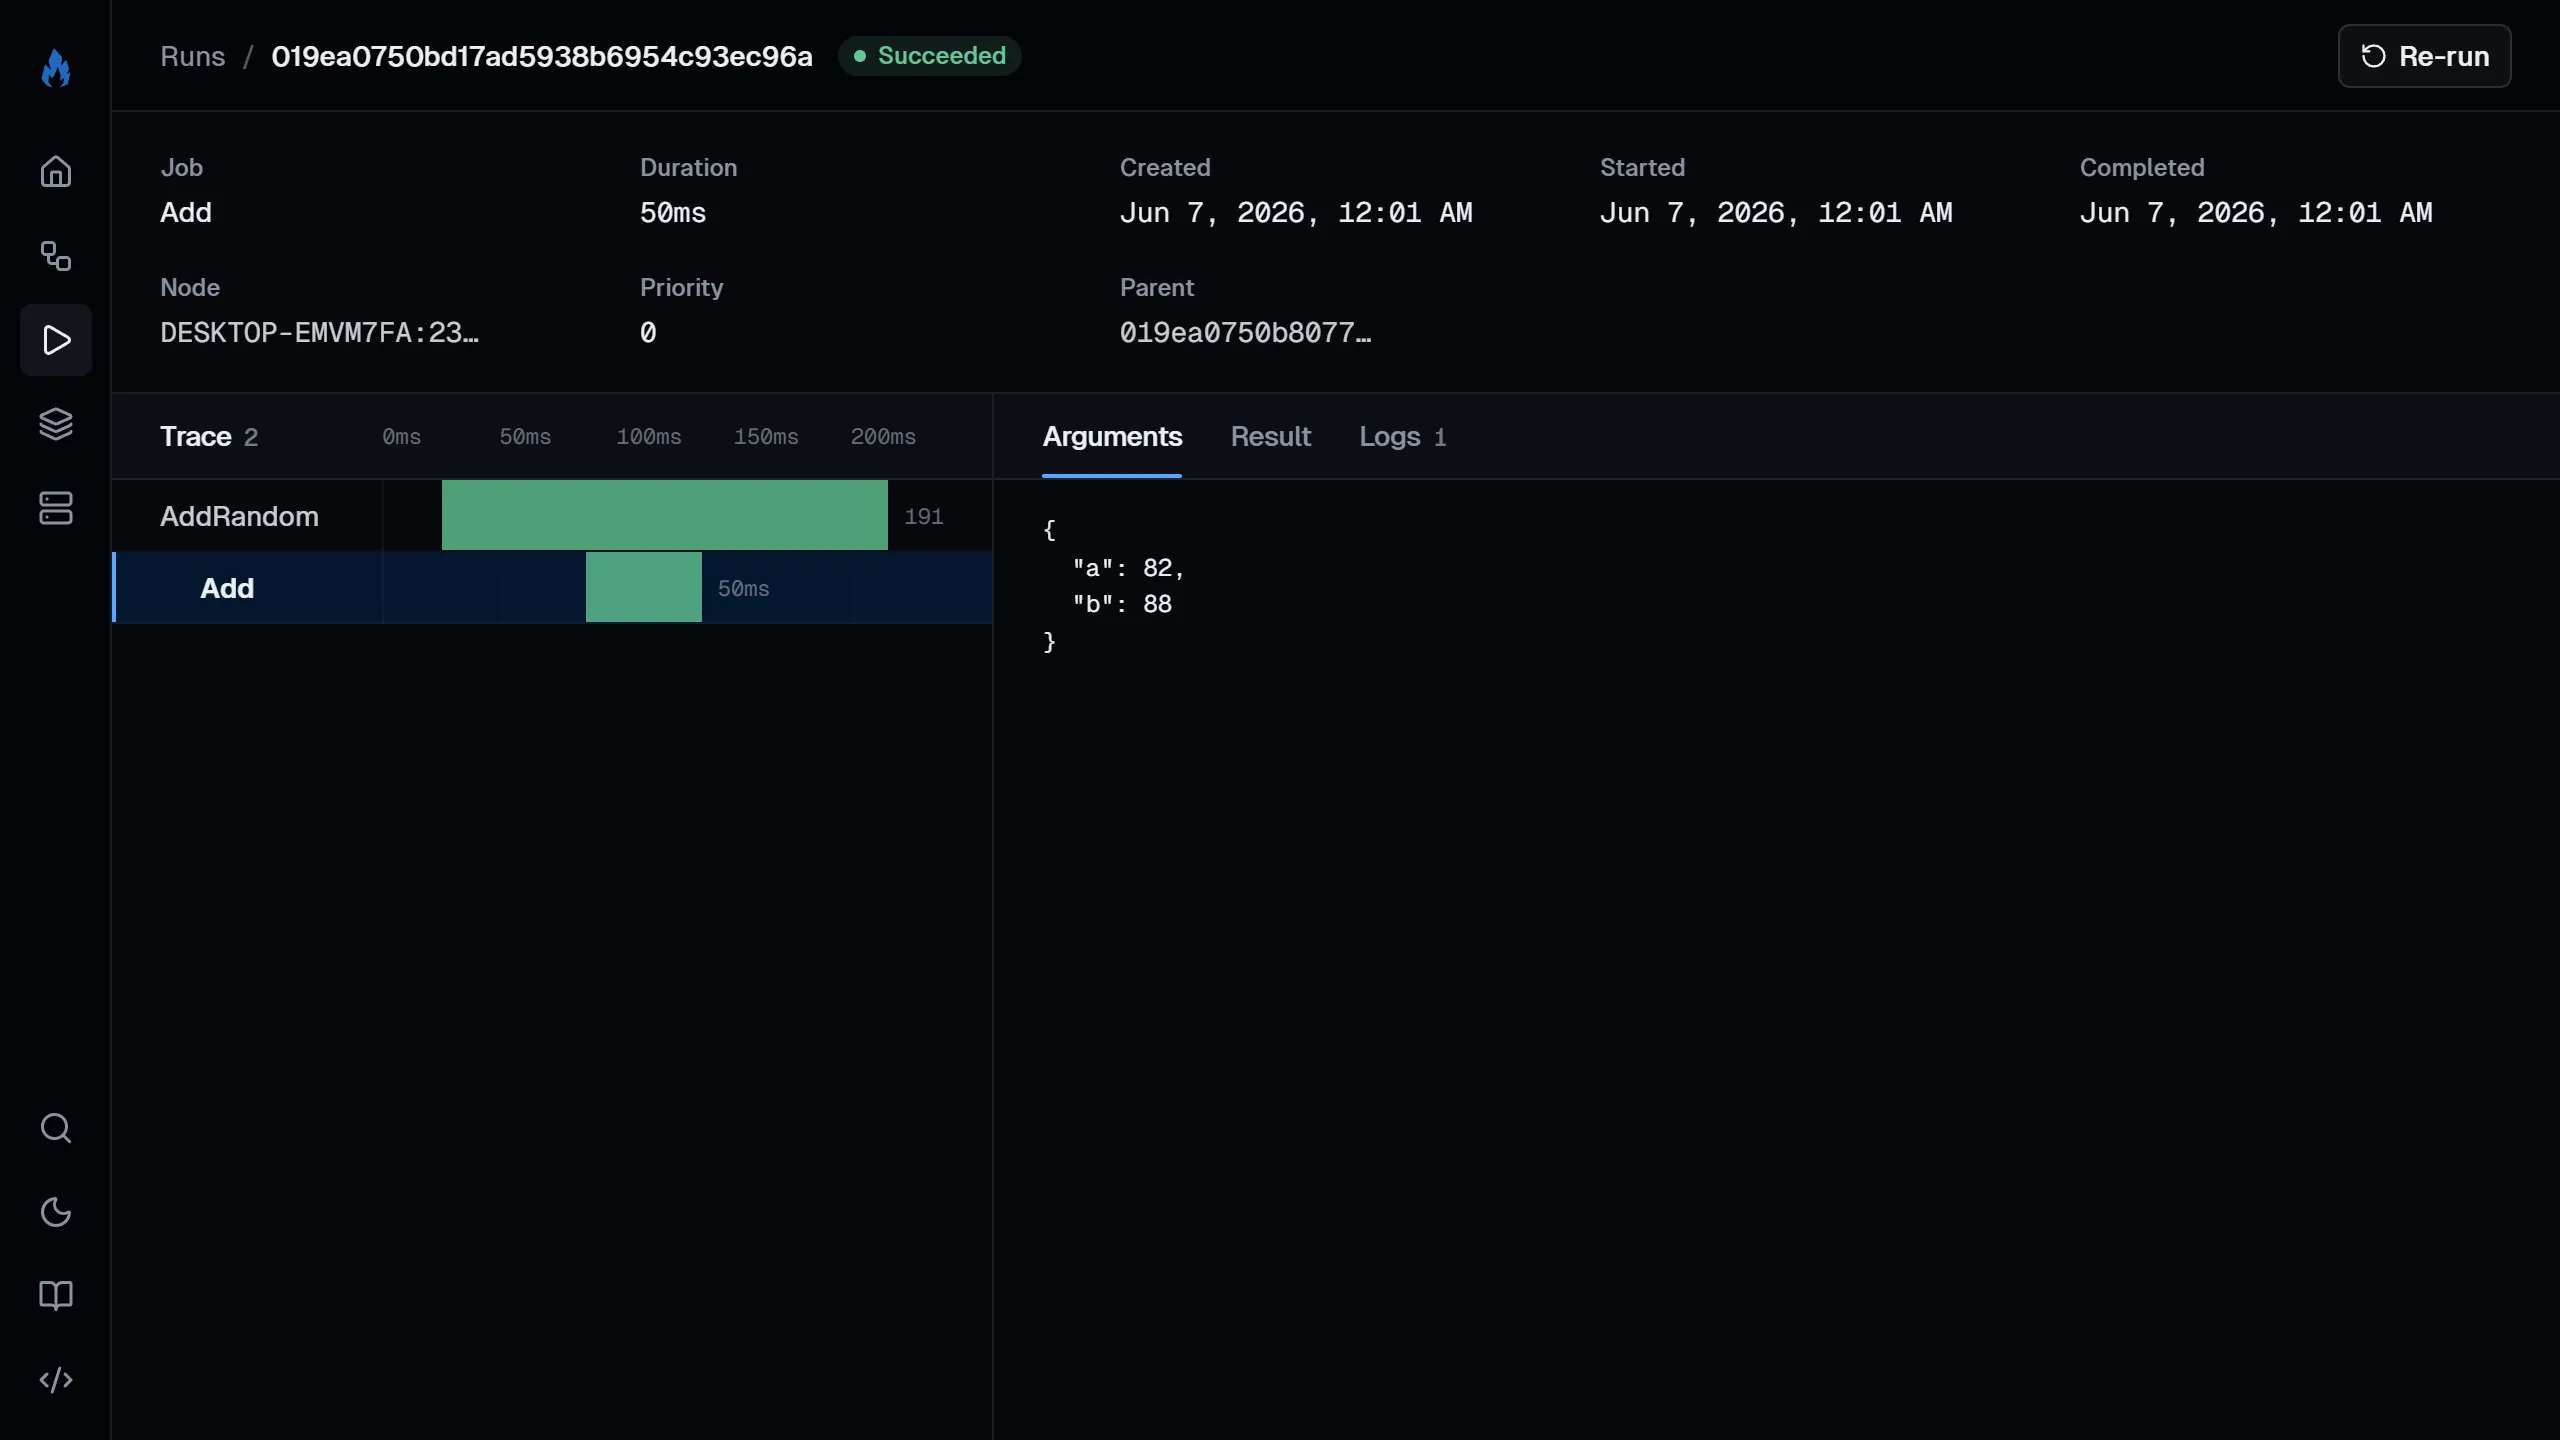
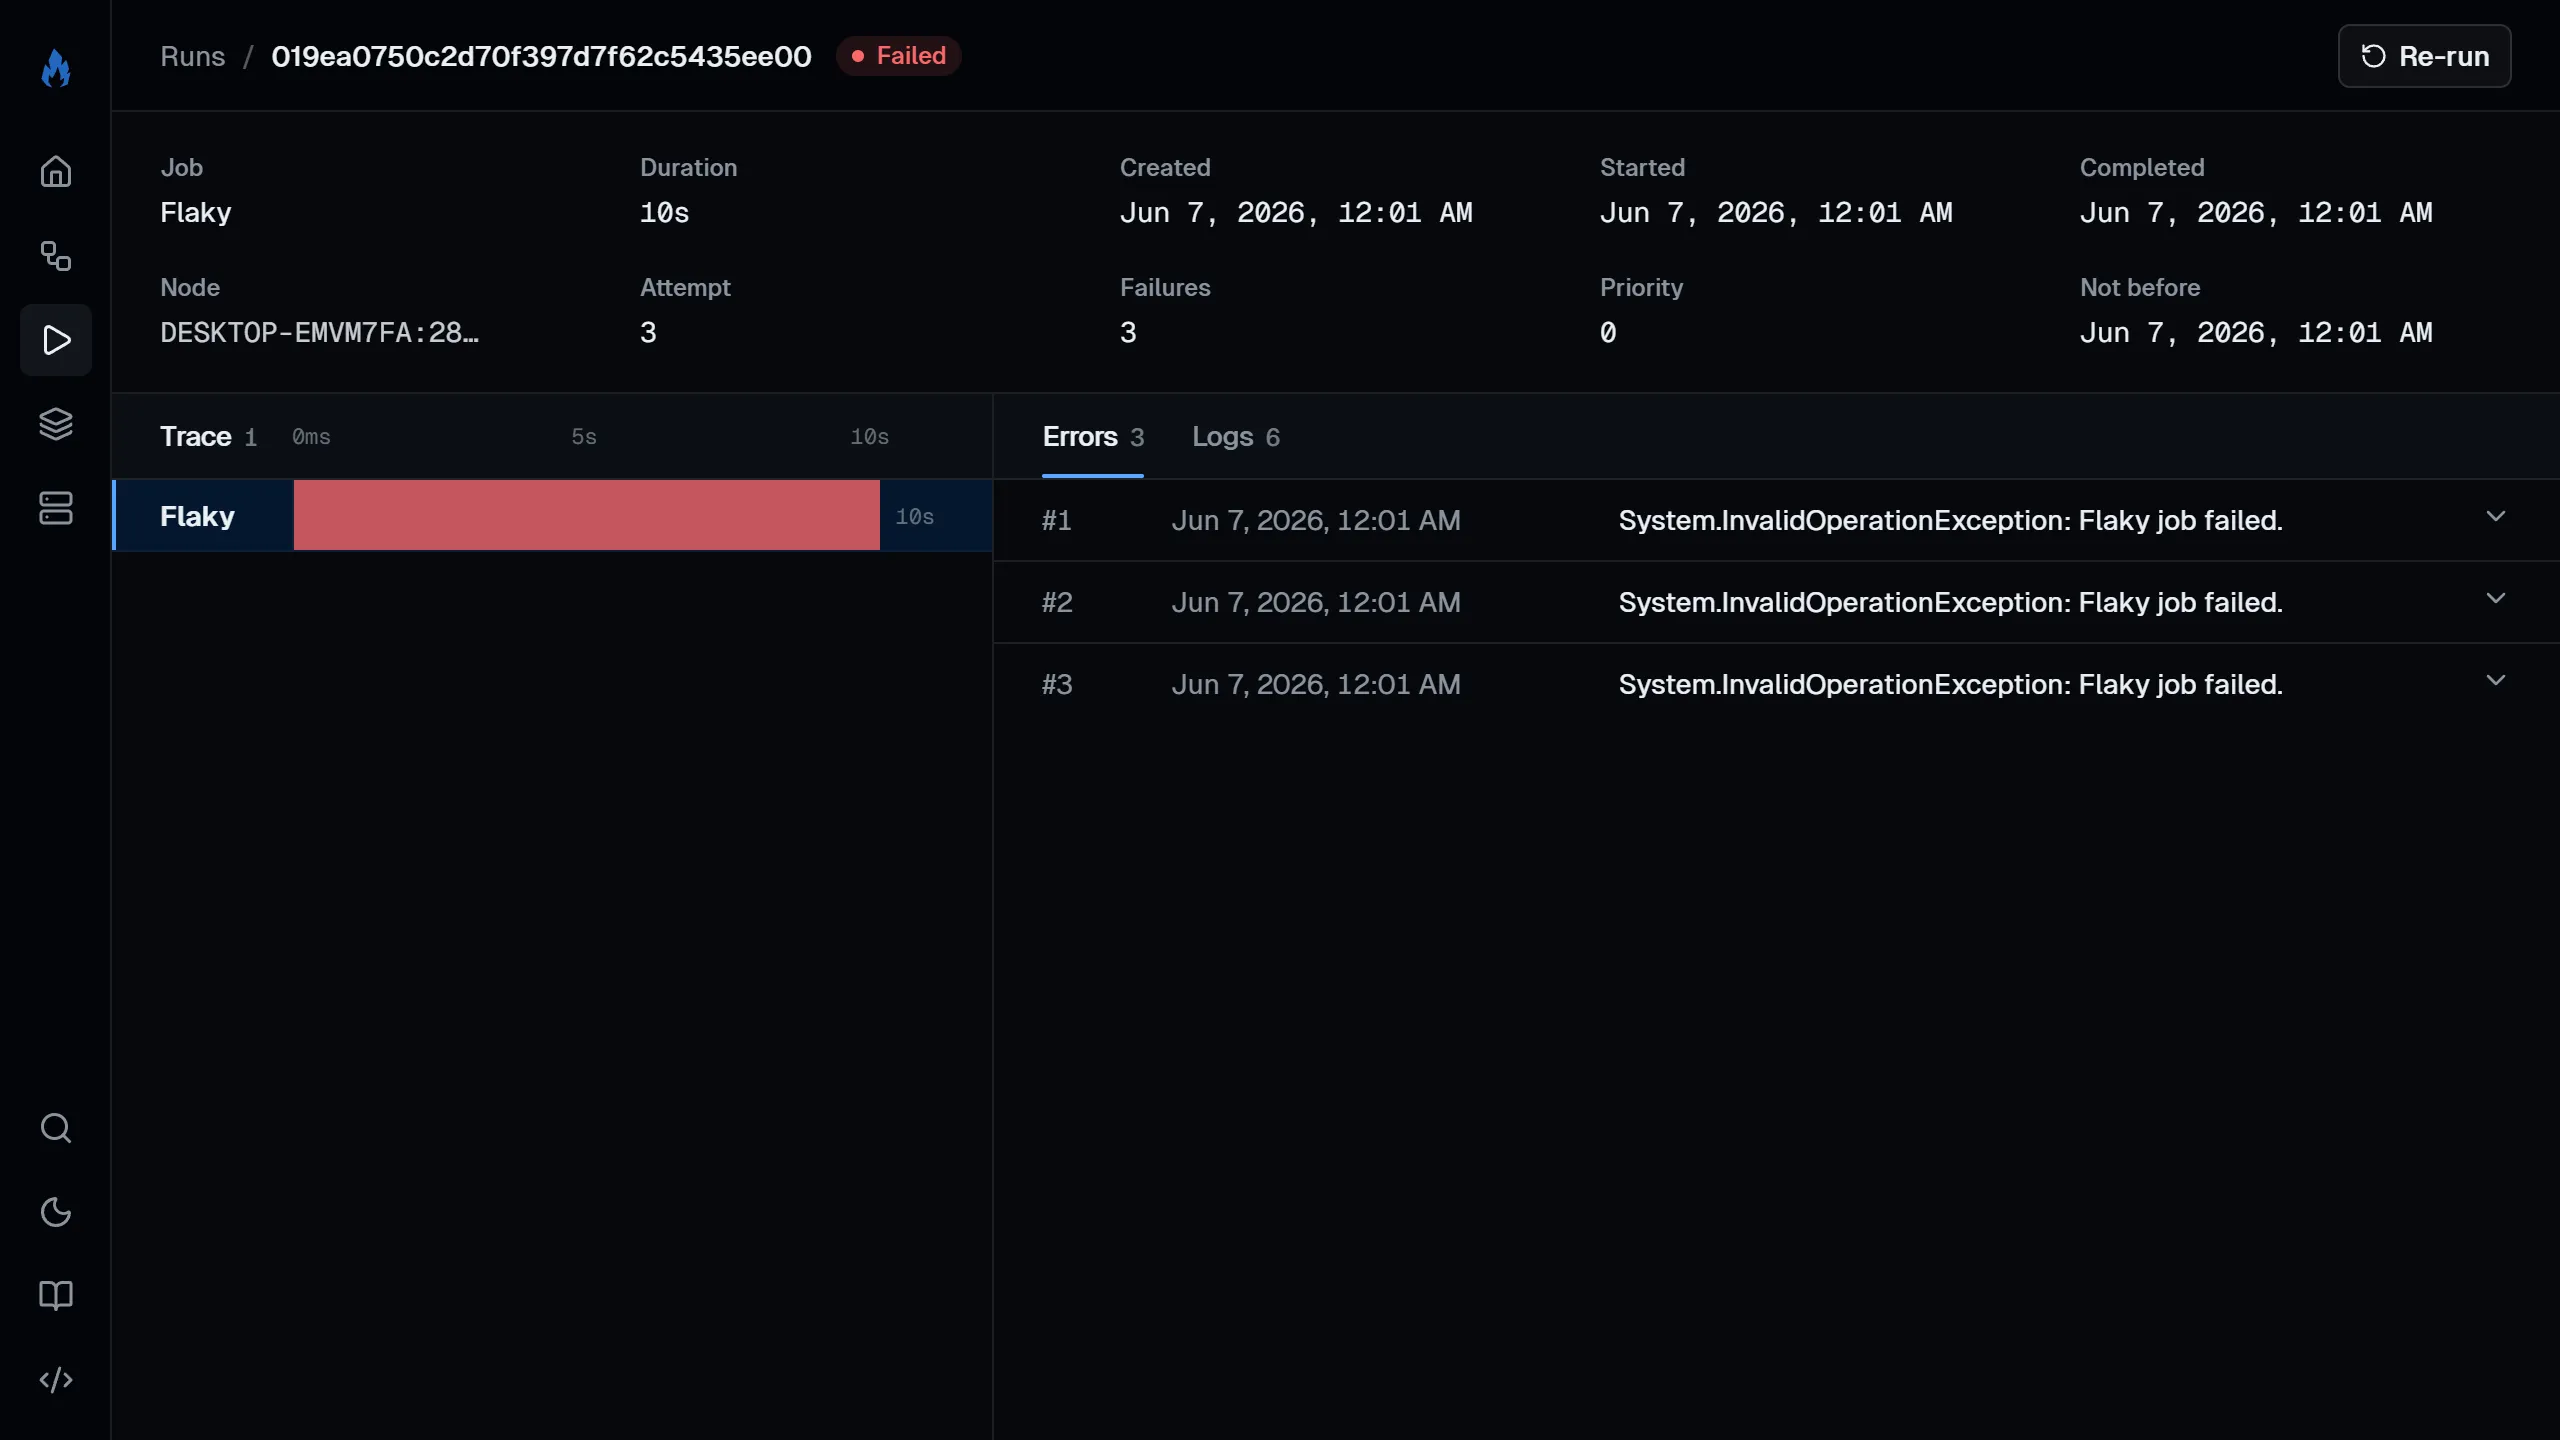
Click into a run to see:
- Live progress bar for running jobs.
- Streaming input, output, and logs that update in real-time as the job runs.
- Arguments and result as formatted JSON.
- Error details for failed runs, with per-attempt stack traces.
- Trace: the full run tree (ancestors, current run, and descendants) with depth and live status.
- Rerun chain: links to the original run and any reruns of it.
From the run page, you can also cancel a running job or rerun a completed one.
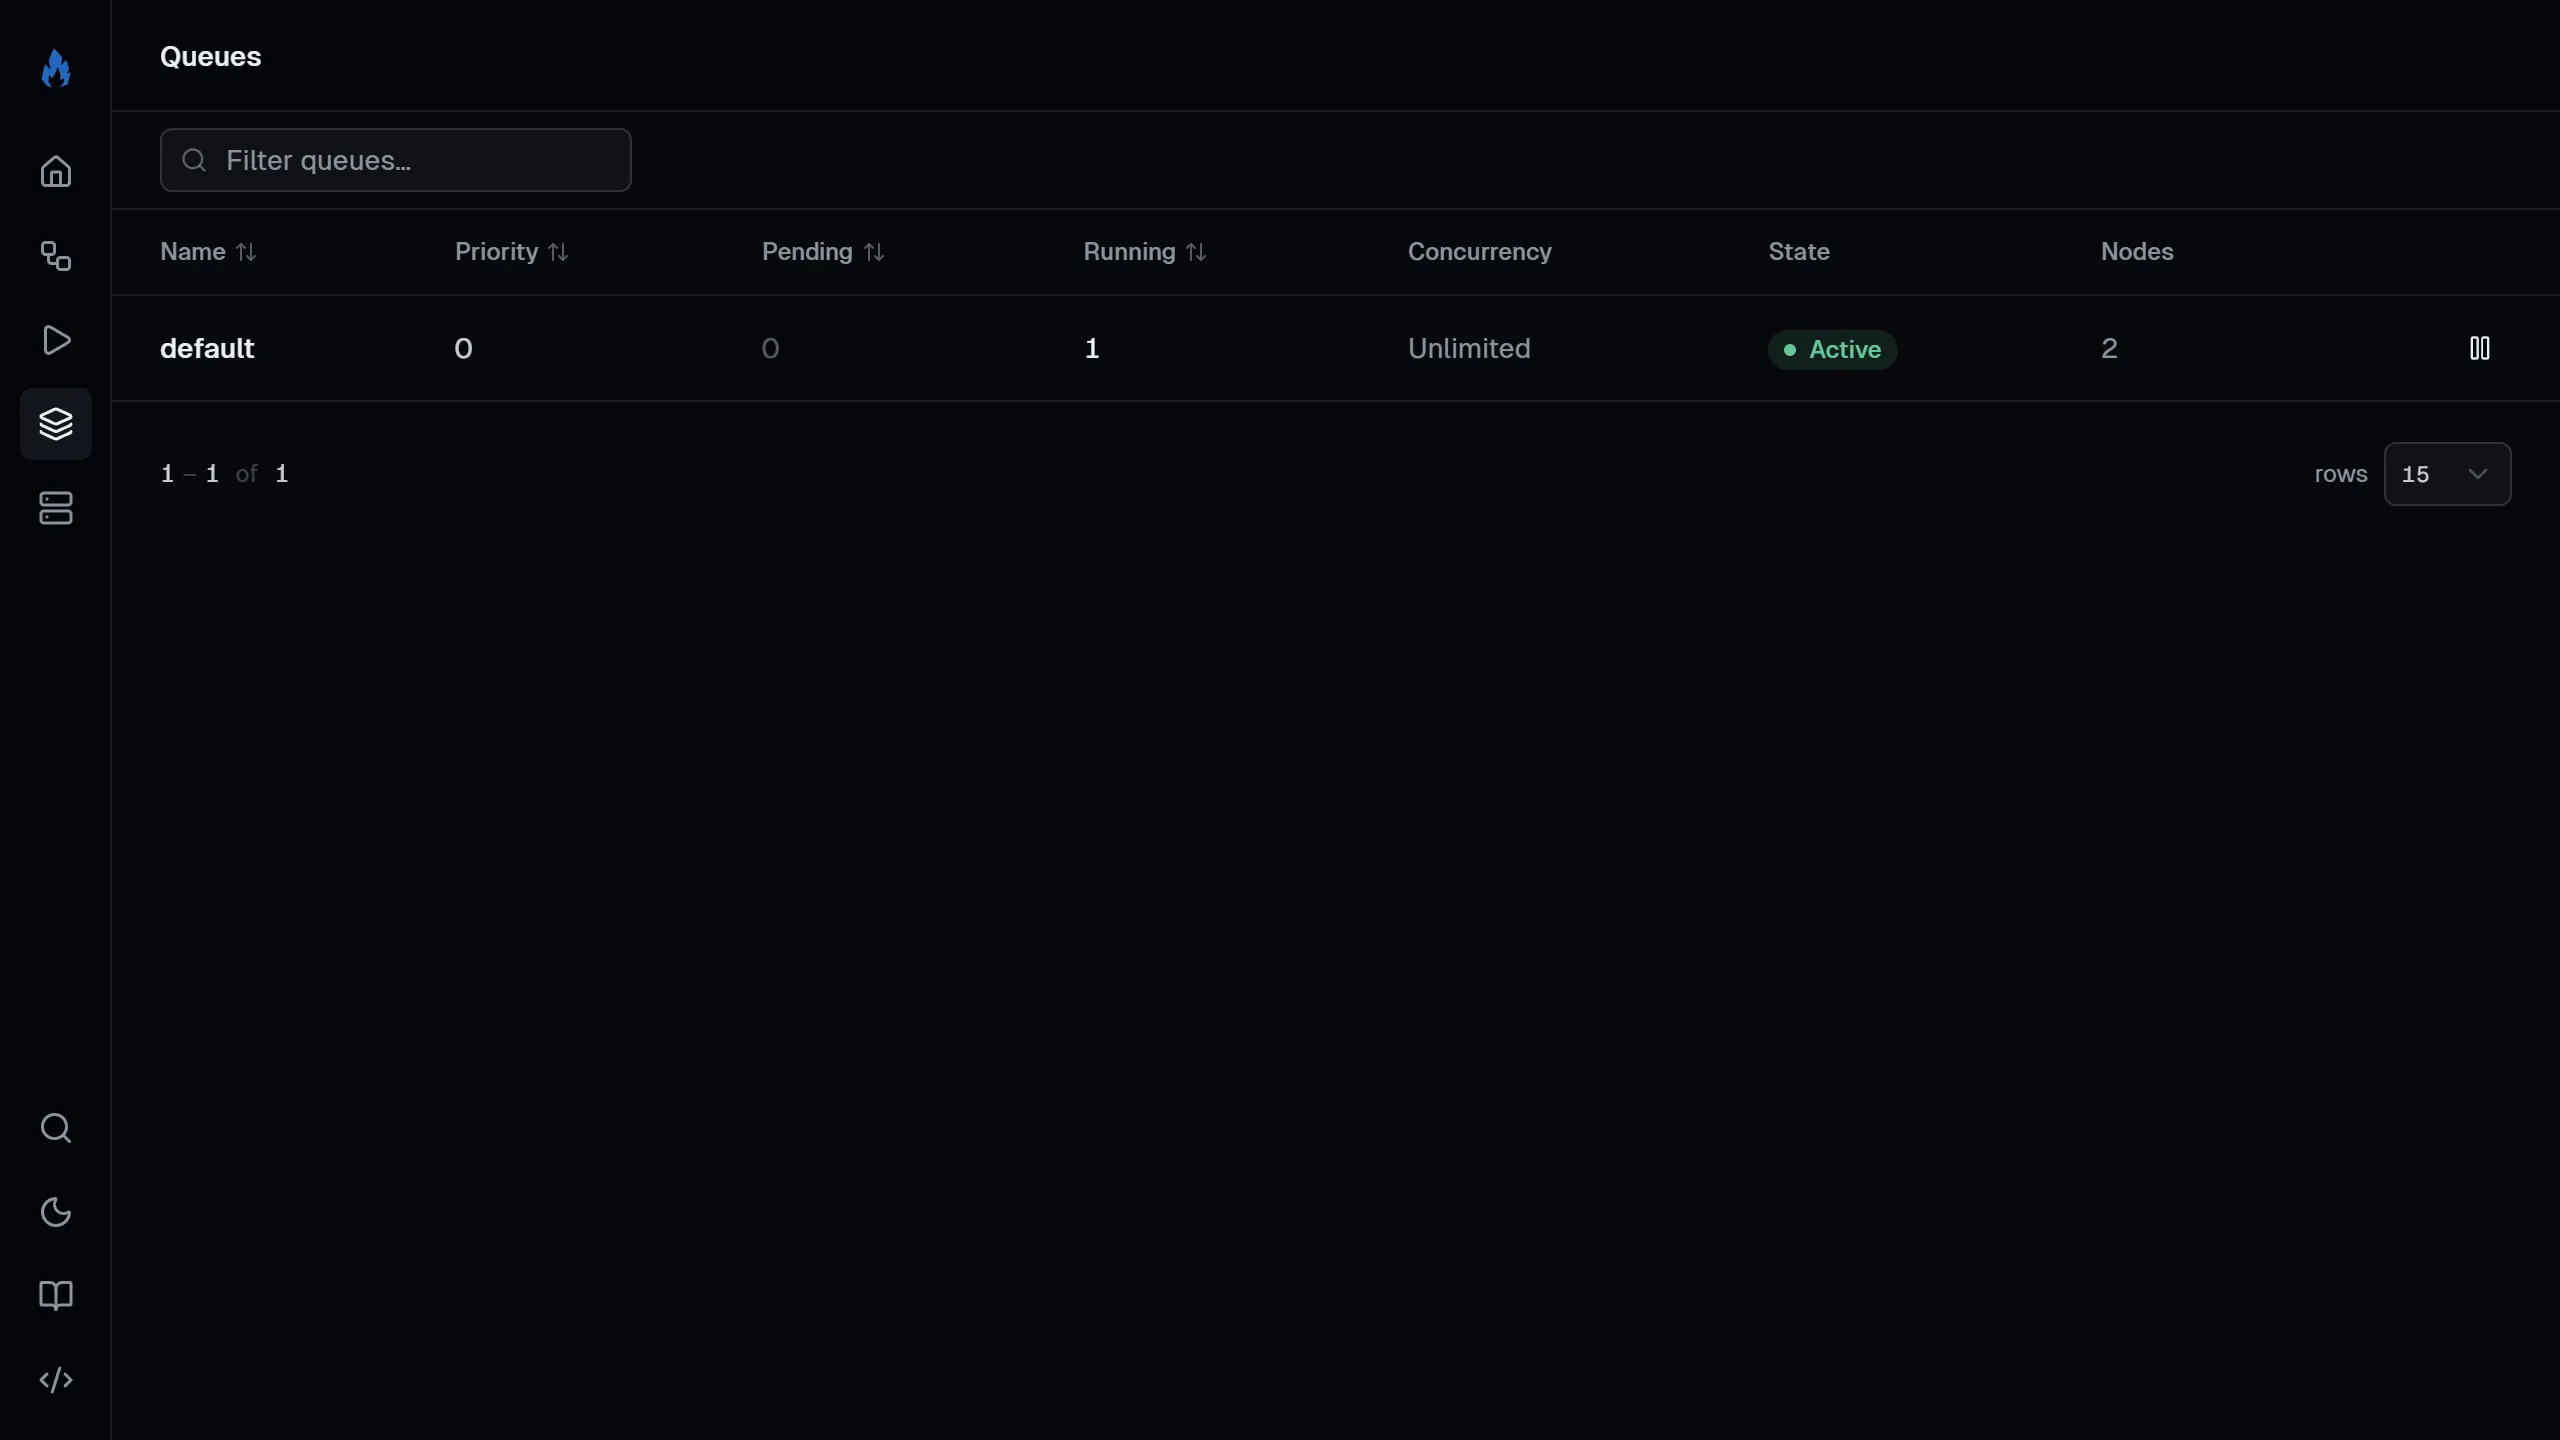
Queues
Section titled “Queues”Lists all queues with their pending run count, concurrency limits, and paused status. You can pause and resume queues from this page. See the queues concept page for more on how queues work.
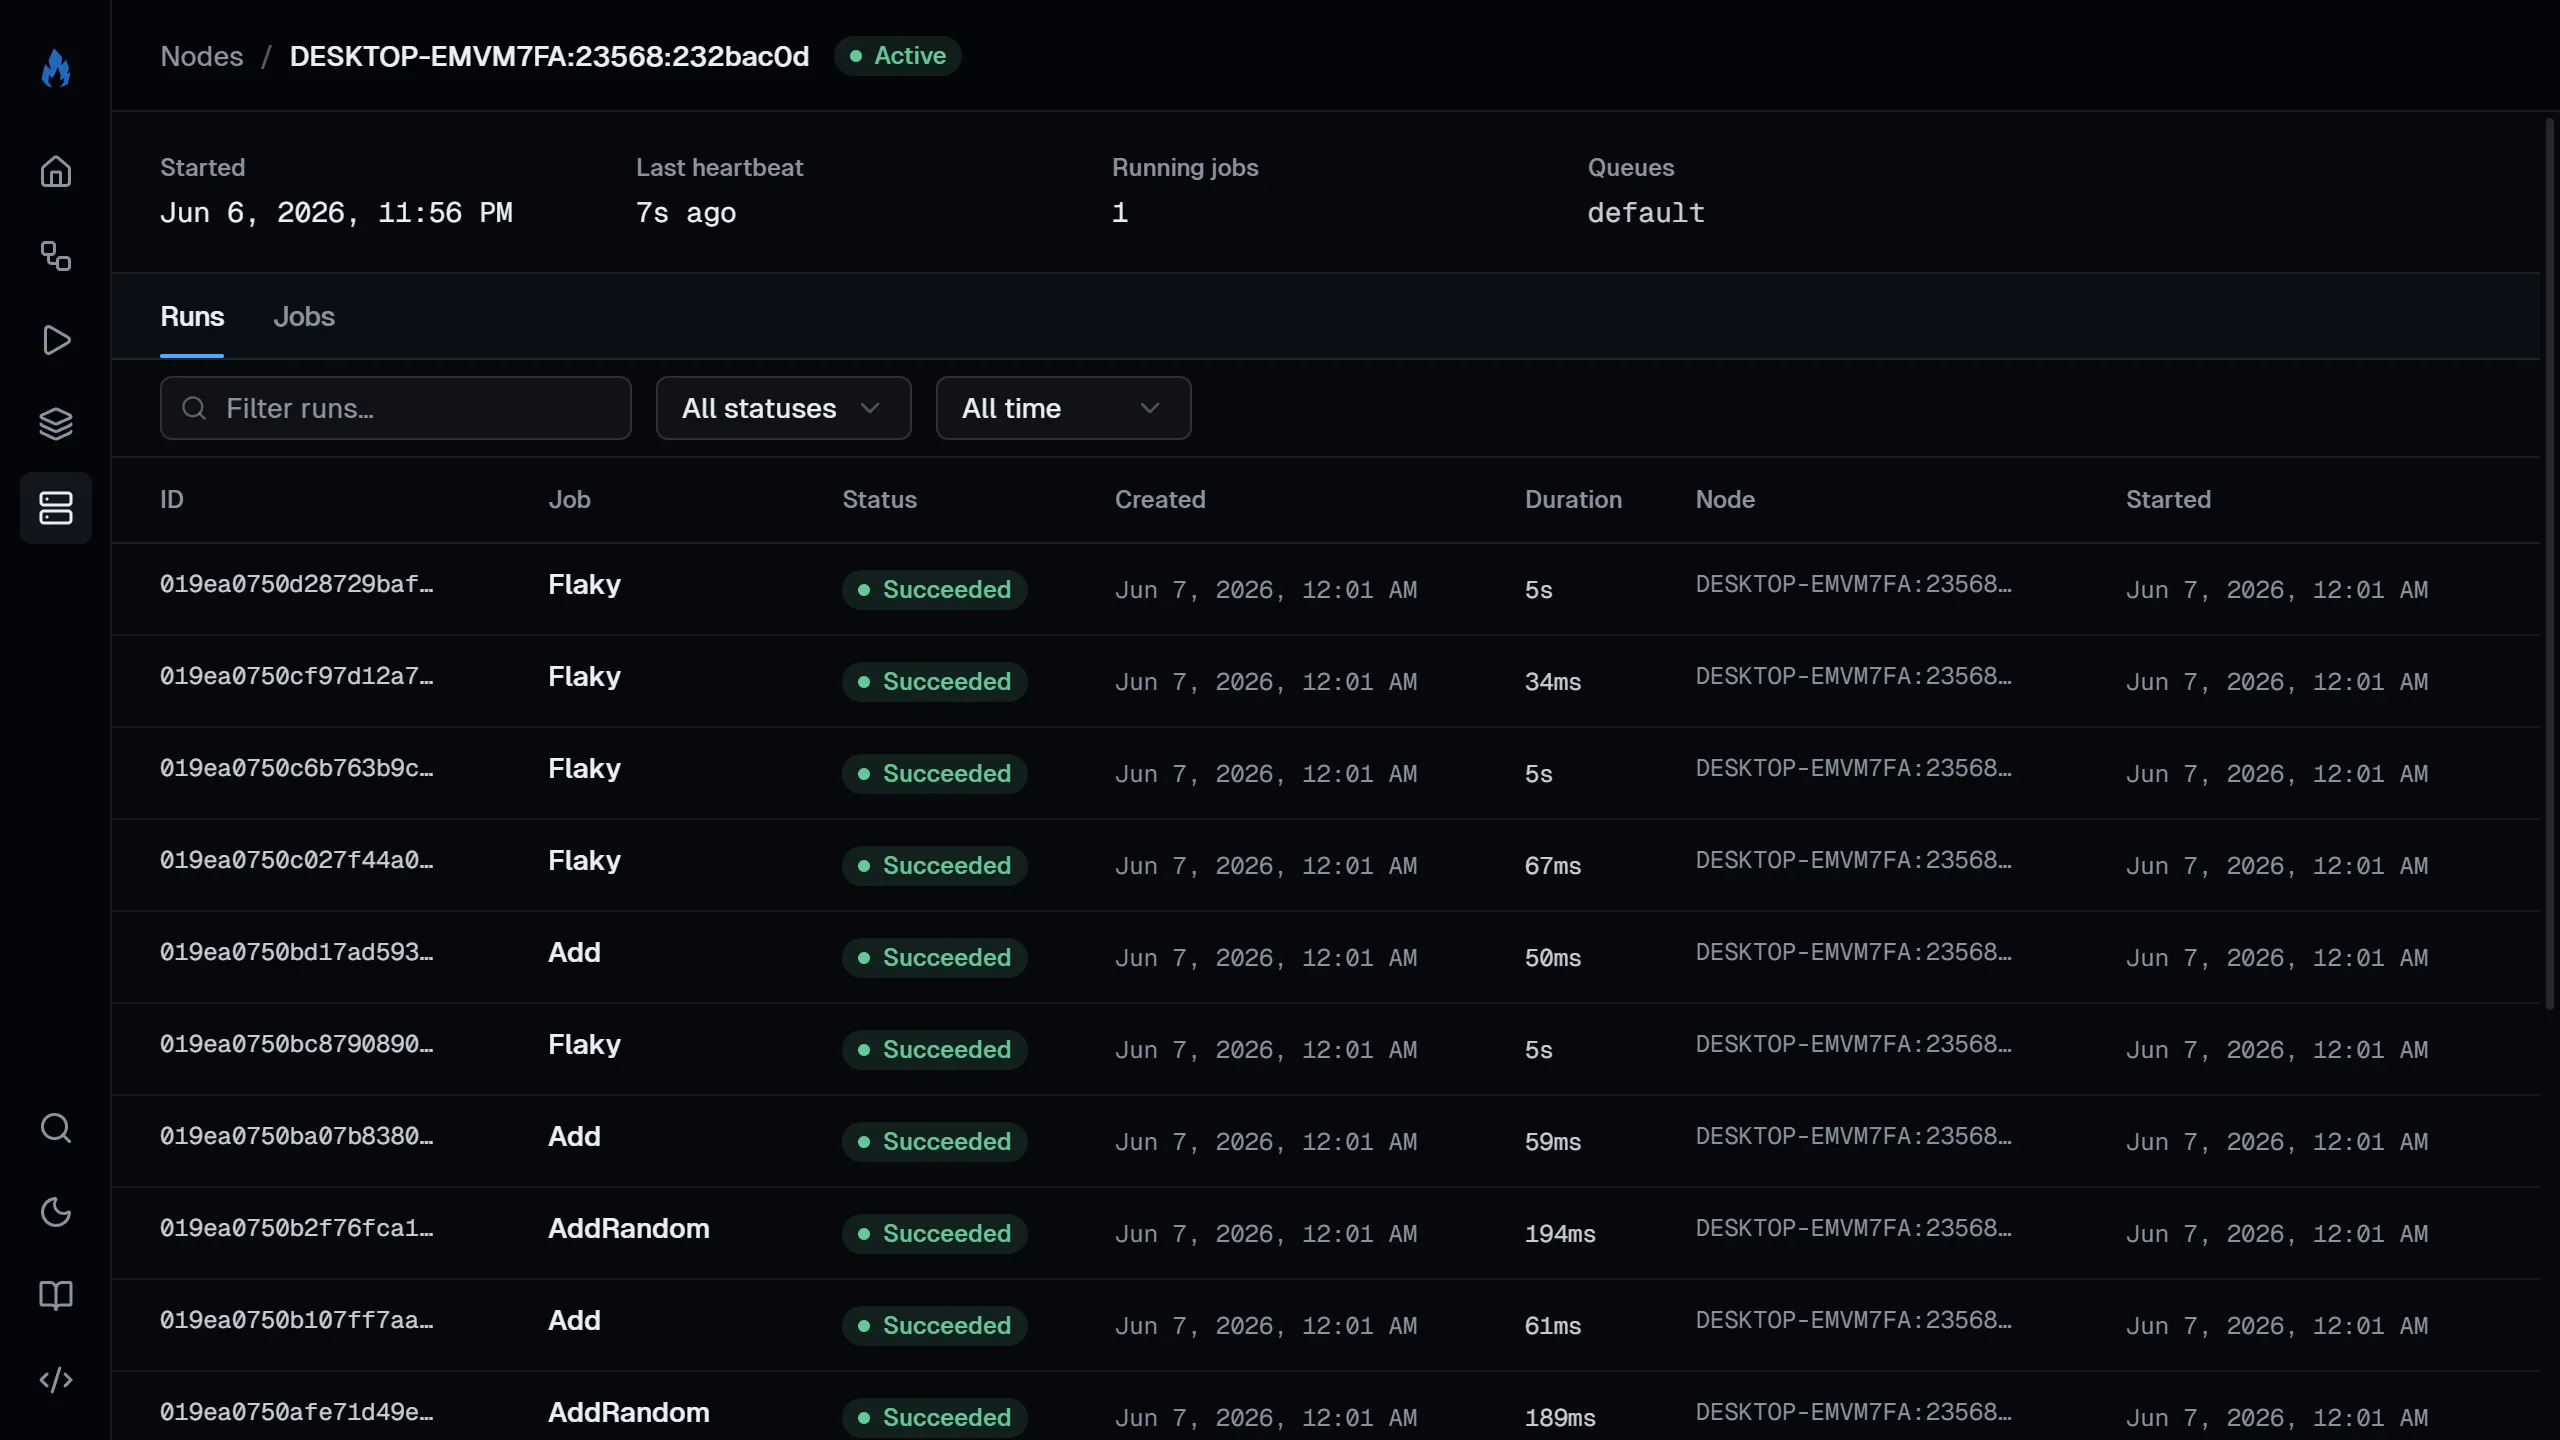
Lists all scheduler nodes with their last heartbeat, running job count, and registered jobs.
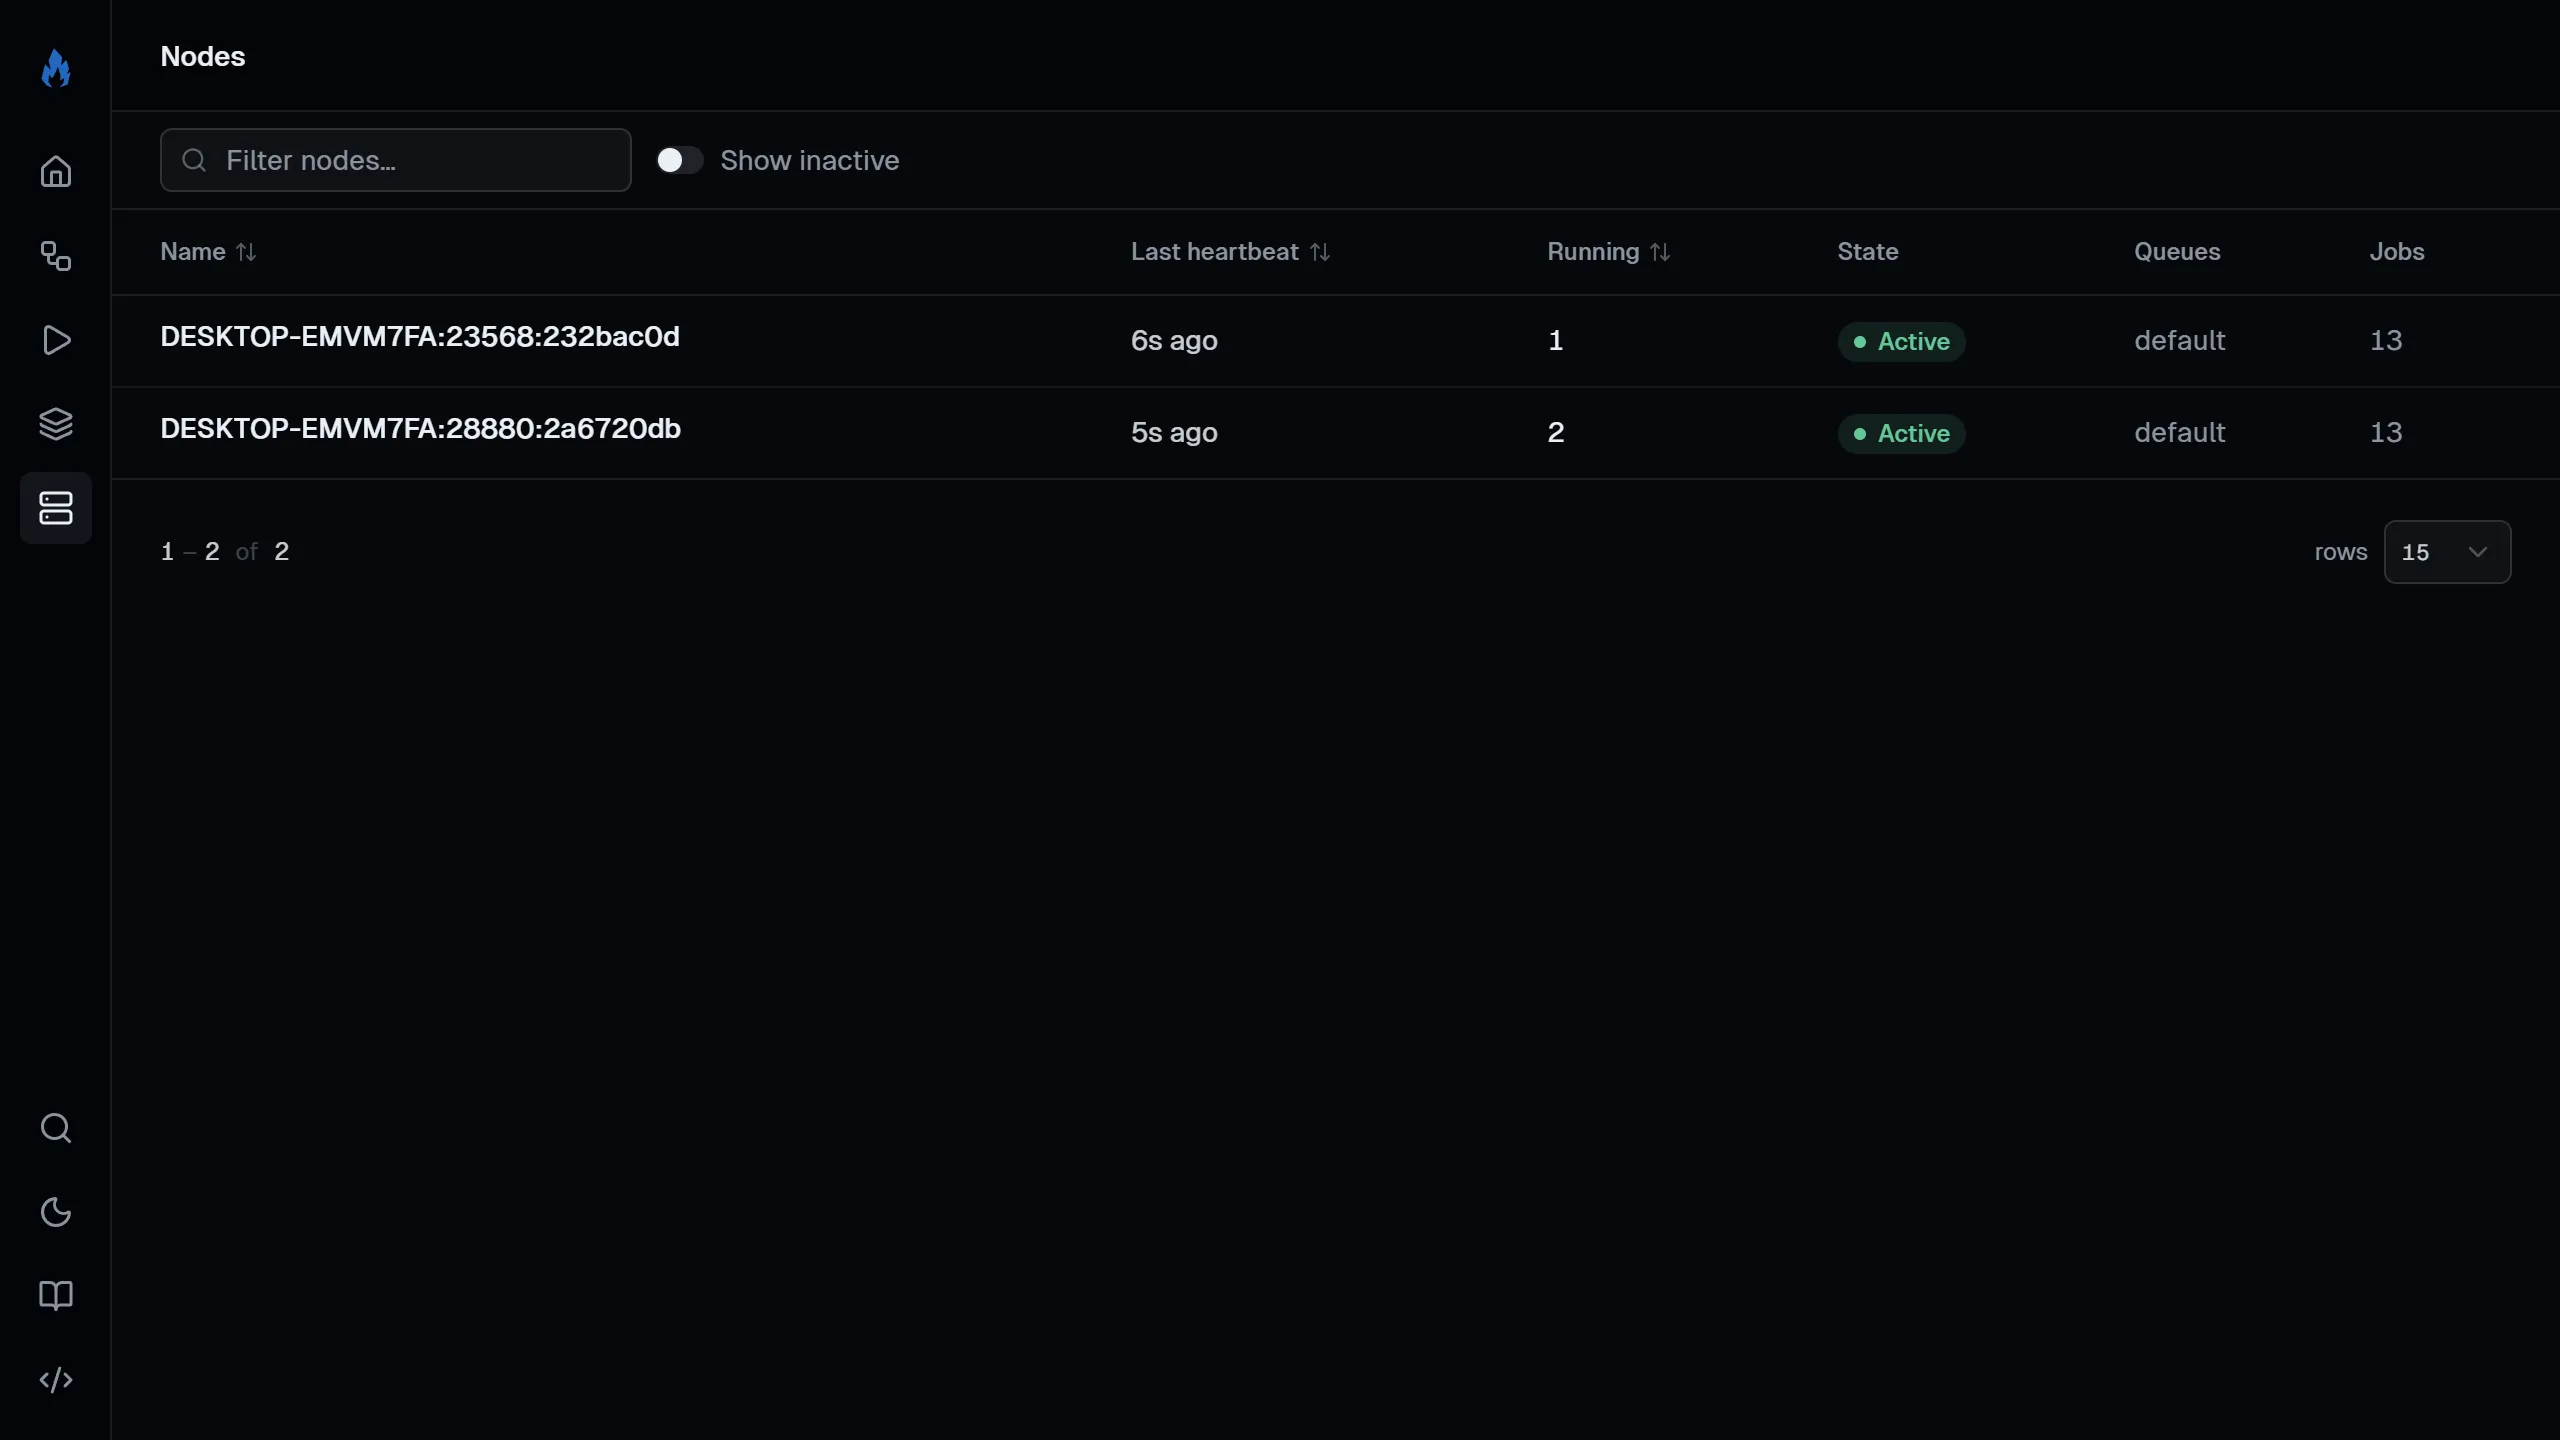
Click into a node to see what jobs it handles and its recent run history.
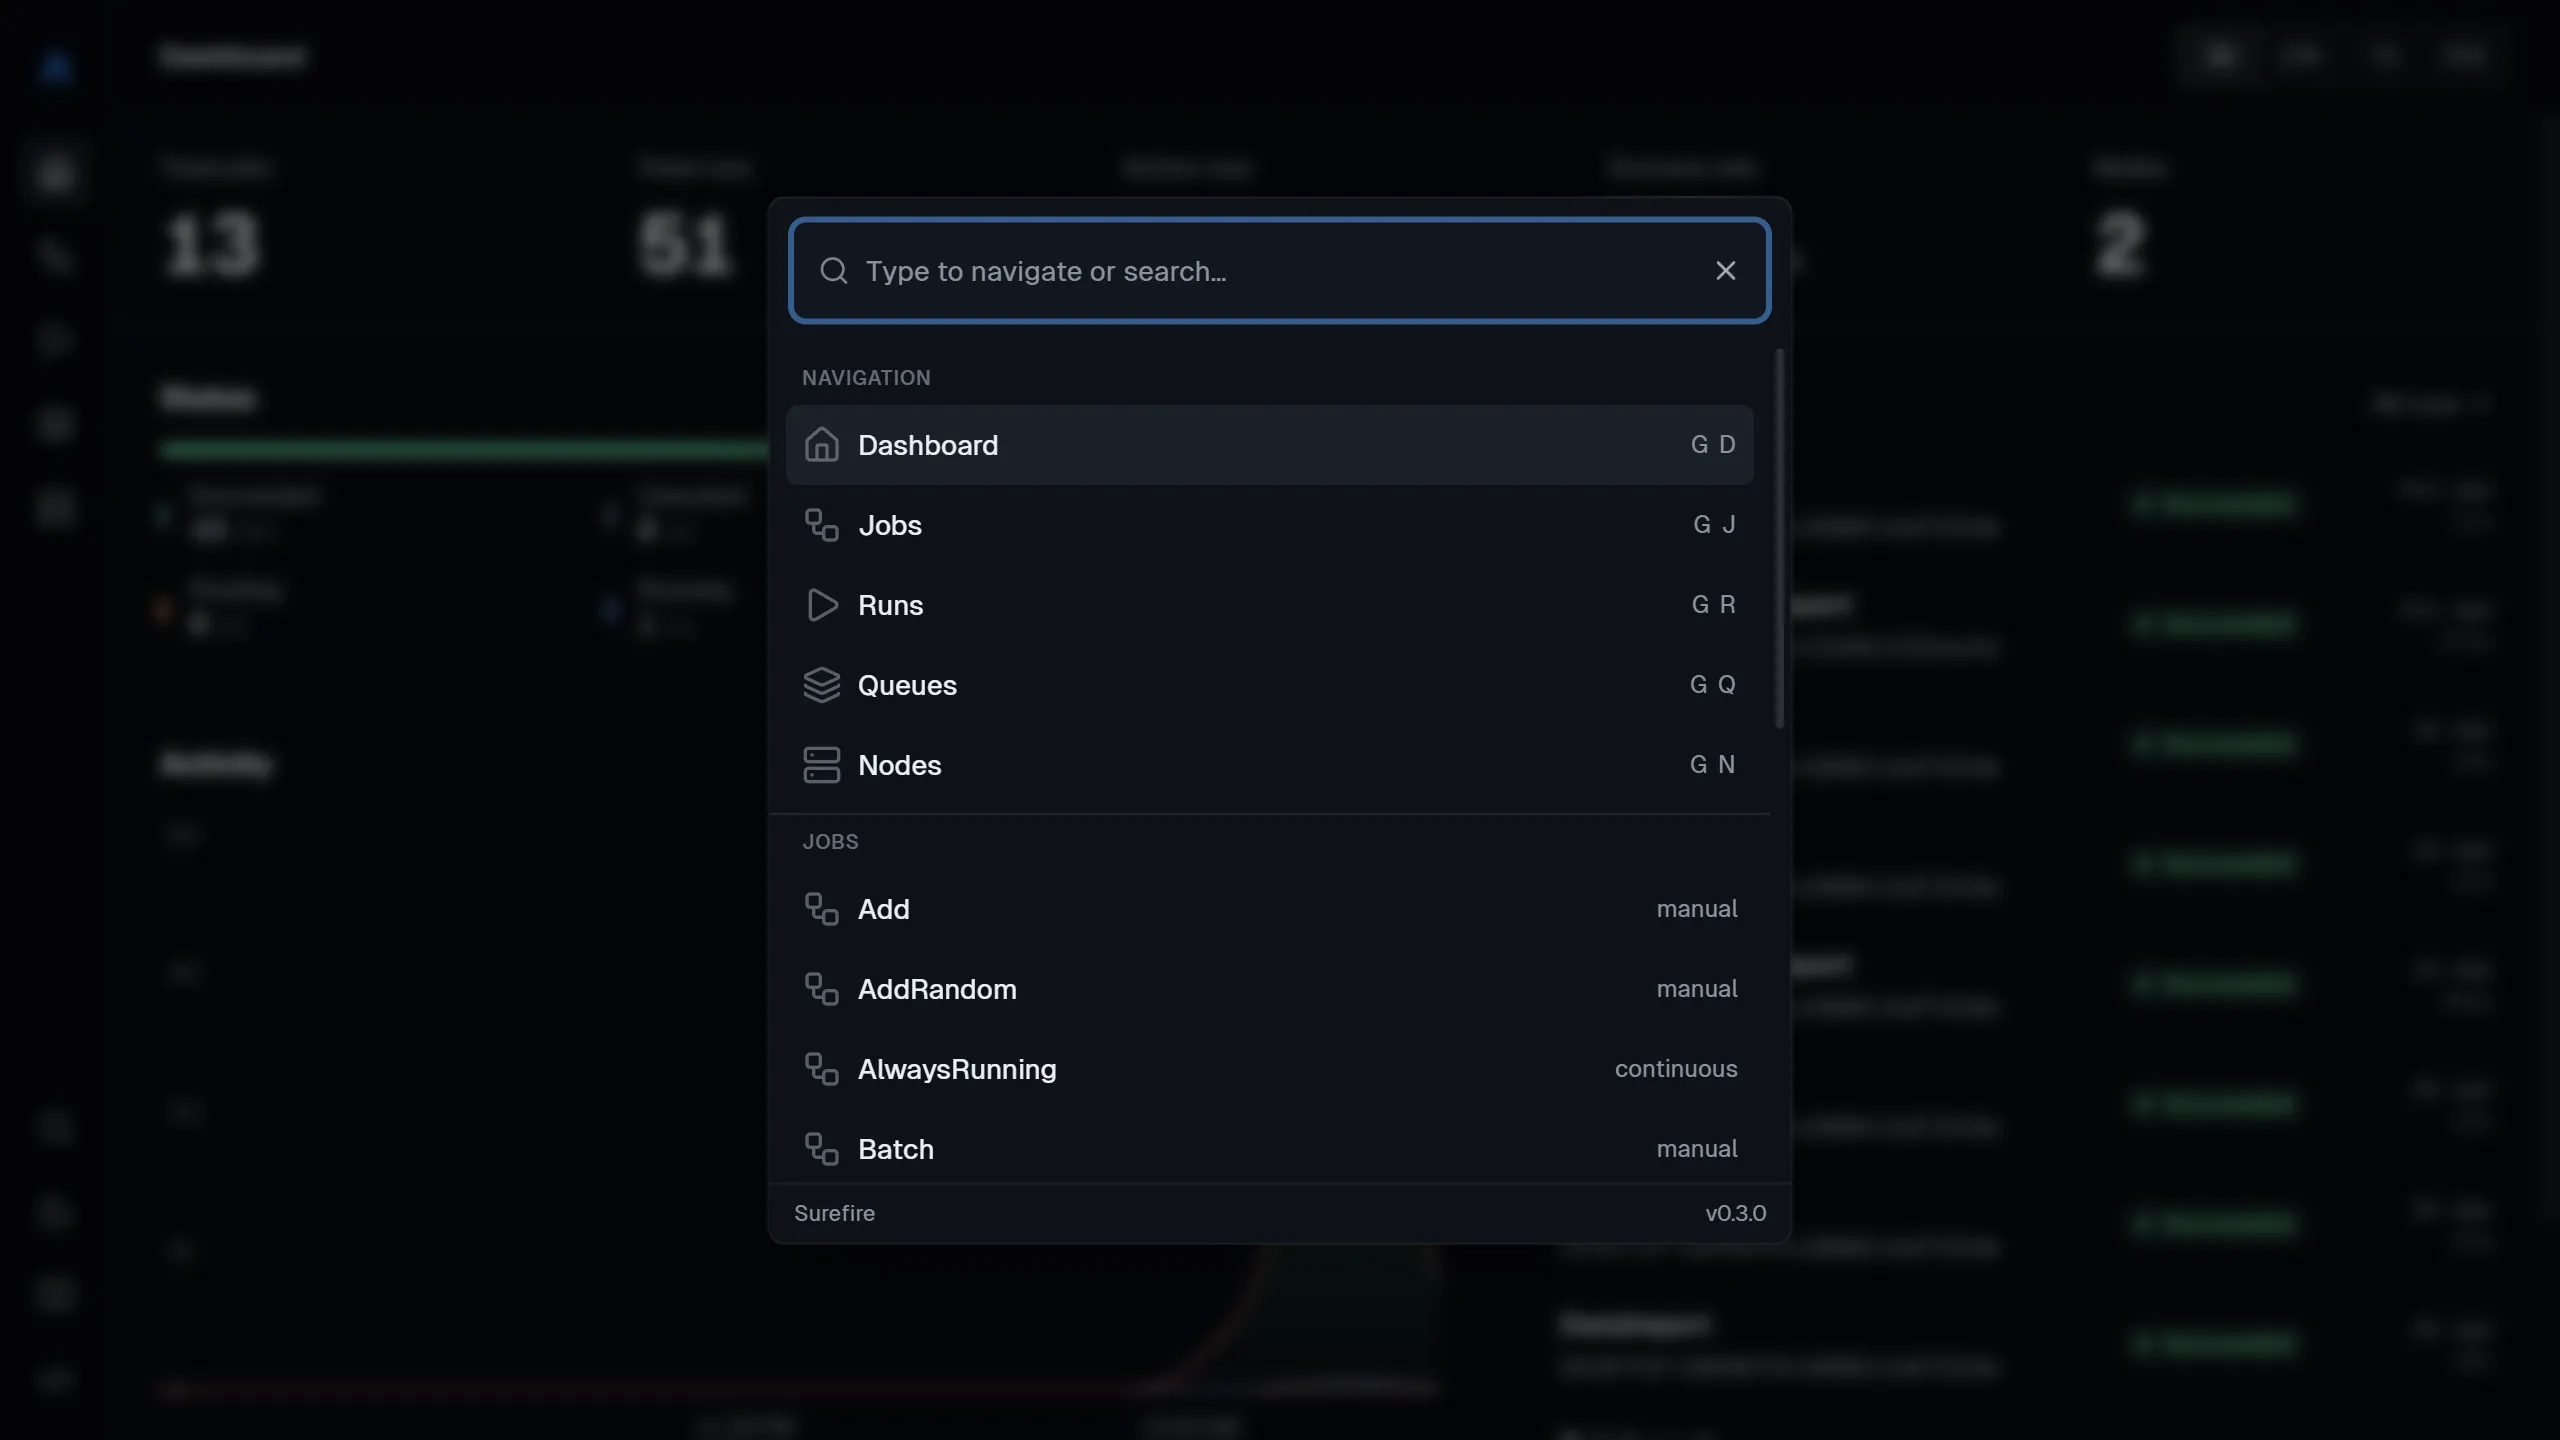
Command palette
Section titled “Command palette”Press / or Ctrl+K (⌘K on Mac) to open the command palette. Jump to any of the main pages, or search for a specific job or node by name.
REST API
Section titled “REST API”The dashboard is built on a REST API at {prefix}/api/. Use it to query jobs and runs, stream run updates, and manage runs and queues from your own tools.
GET /api/stats # dashboard statisticsGET /api/jobs # list all jobsGET /api/jobs/{name} # get a single jobGET /api/jobs/{name}/stats # get job-level statsPATCH /api/jobs/{name} # update a job (enable/disable)POST /api/jobs/{name}/trigger # trigger a new runGET /api/runs?jobName=X&take=20 # list runs with filtersPOST /api/runs/lookup # refresh many runs by id (JSON body: {"ids":[...]})GET /api/runs/{id} # get a single runGET /api/runs/{id}/logs # get parsed log eventsGET /api/runs/{id}/stream # live logs & progress (SSE)GET /api/runs/{id}/tree # run treePOST /api/runs/{id}/cancel # cancel a running jobPOST /api/runs/{id}/rerun # re-run a completed runGET /api/queues # list all queuesPATCH /api/queues/{name} # update a queue (pause/resume)GET /api/nodes # list all nodesGET /api/nodes/{name} # get a single node